The City's bike counters on Cannon are missing more than half the bike trips that use the cycle track. This has implications for how we measure and evaluate its success.
By Ryan McGreal
Published August 10, 2016
This article has been updated.
An analysis of Hamilton Bike Share trips finds that most bike share users who ride on the Cannon Street cycle track are using it as a local collector street for short trips, and not as a crosstown thoroughfare.
Due to the placement of bike counters along the Cannon cycle track, less than half of these trips are being counted.
This has significant implications for how bike traffic on the street is measured and how the success of the cycle track is evaluated.
The good news is that the City of Hamilton recognizes this and plans to incorporate bike share data into its bike traffic analysis.
In September 2014, the City of Hamilton officially opened a new 3.3 km protected two-way cycle track on Cannon Street between Sherman Avenue North and Hess Street North. Ridership immediately increased from approximately zero to hundreds of trips a day, and has continued to grow steadily since then.
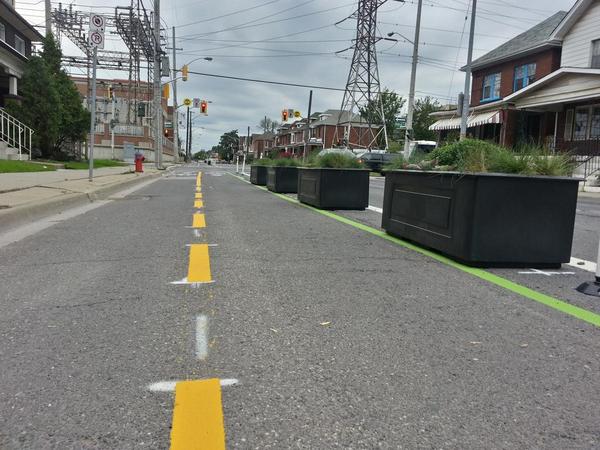
Cannon Cycle Track (RTH file photo)
Anecdotally, I encounter plenty of other people cycling every time I ride on Cannon, but people whose only interaction with the street is from behind the windshield of an automobile sometimes complain that they don't see anyone using the Cannon Cycle Track.
For some time I've been nursing the hypothesis that a significant fraction of the bicycle traffic on Cannon Cycle Track is local, short-distance trips rather than long, crosstown trips. I wish I could take credit for this hypothesis, but I first read it in an RTH comment and it has stuck with me ever since.
While this squares with my anecdotal experience of the street, it's always much preferable to have something more rigorous on which to base a conclusion than subjective impression.
The City has several bike counters on Cannon Street: near Birch Avenue, near Wellingon Street North, near John Street North, and near Bay Street North.
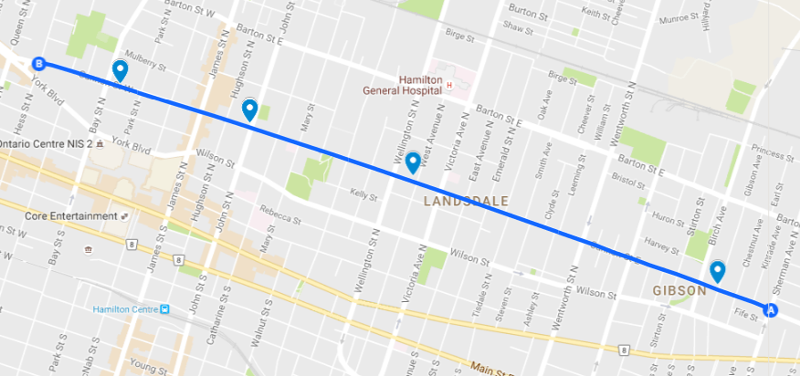
Map: bike counters installed on Cannon Cycle Track (Image Credit: Google Maps)
It makes sense to install the counters this way if your assumption is that most of the traffic you will be counting is using the street as a corridor, similar to most automobile traffic on the street.
But if people on bikes are using Cannon for short trips rather than long ones, the arrangement of counters is going to miss a lot of those shorter trips.
RTH contacted the City to ask for the current traffic counts at the Cannon cycle track counters and received the following response from Daryl Bender, Project Manager, Alternative Transportation with the Public Works Department.
The numbers are from early July, 2016.
Looking for an alternative data source to try and analyze bike traffic on Cannon, I decided to see what I could get from Hamilton Bike Share.
This not-for-profit bike share system launched in March 2015, providing 750 bikes and 115 stations over a service area from Dundas to Ward 3 and the waterfront to the Escarpment. It has grown rapidly in membership and ridership, and currently has over 10,000 active members taking around 8,000 trips a week, totalling around 20,000 km.
Obviously, Hamilton Bike Share trips comprise only a fraction of all the bike trips in the City, but it should be able to provide a sense of the pattern of bicycle use on Cannon.
I have been designated a research partner with Hamilton Bike Share, which means I have access to anonymized trip data. One of the available formats is GPX, a file format that defines the route of a trip by an ordered set of GPS latitude and longitude coordinates.
Here is an example of a GPX file, in this case a bike share trip I took on August 3 from Bay and Napier to King and Dundurn via York Boulevard.
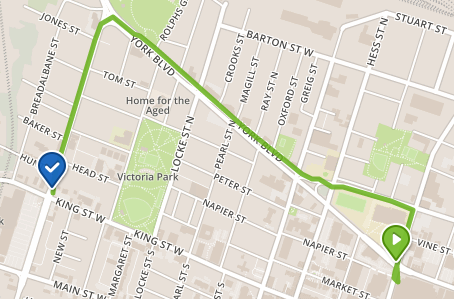
Map of GPX example bike share ride
Because GPX files can get extremely large (a given data set includes every GPS point for every bike trip being studied), I based the analysis on seven days' worth of data: the week from Sunday, July 18, 2016 to Saturday, July 24, 2016.
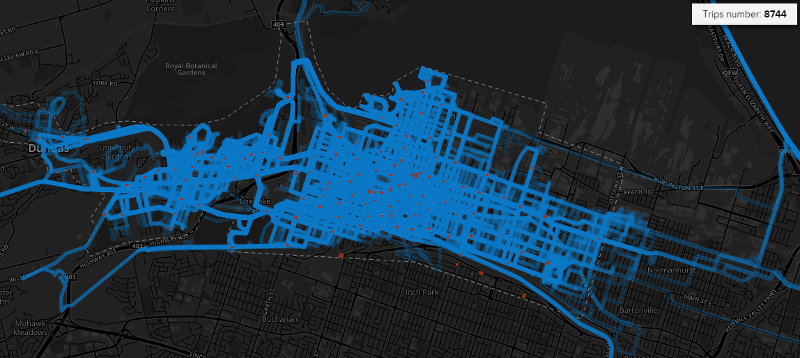
Heatmap of bike share trips between July 18, 2016 and July 24, 2016 (Image Credit: Social Bicycles)
For the analysis, I defined 57 segments of Cannon Street and York Boulevard between Ottawa Street North and Dundurn Street North. Each rectangular segment matches a block between two cross streets and is defined by four sets of GPS coordinates. (GPS is generally accurate to around 10 metres, so I added some padding on either side of the street to catch stray points.)
I also grouped the segments into three sections: east of the cycle track, on the cycle track, and west of the cycle track.
The cycle track itself runs on Cannon between Hess Street North and Sherman Avenue North. East of the cycle track, there is no cycling infrastructure on Cannon between Sherman and Lottridge, but there are painted bike lanes between Lottridge and Ottawa. West of the cycle track, there are buffered painted bike lanes on York between Hess and Dundurn.
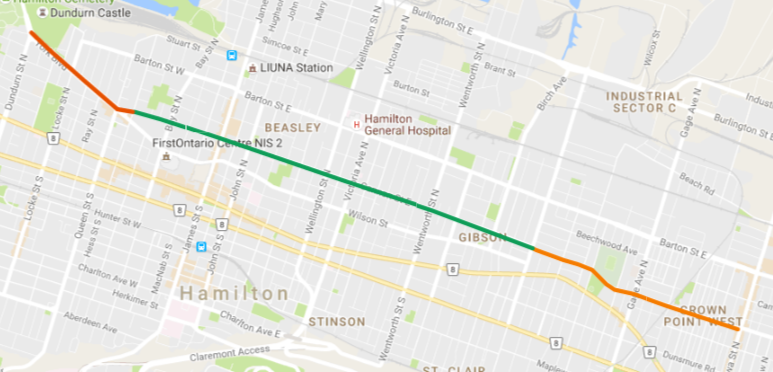
Map: east of cycle track in orange, cycle track in green and west of cycle track in dark orange (Image Credit: Google Maps)
There were 8,744 bike share trips between July 18 and July 24, 2016, traversing a total distance of 20,640.34 km. Each GPS point for each trip was tested against the defined set of Cannon/York segments to see if the point fell within one of the segments. (You can see the script I used to do this.)
Of the 8,744 trips, 2,377 - or 27.18 percent - touched on at least one of the 57 defined segments along Cannon/York between Ottawa and Dundurn. Those 2,377 trips traversed 6,955.69 km, and the overall average distance travelled was 2.93 km (the longest overall distance was 26.83 km).
That 2.93 km is the average total distance for the trips that touched on Cannon/York, and it includes the entire trip, not just the portion of the trip that was on Cannon/York. Only 22.13 percent of the GPS points in those trips fell within one of the defined segments along Cannon/York.
There is not an exact correlation between two GPS points and a specific unit of distance, but it can serve as a rough approximation. If we take 22.13 percent of the average 2.93 km trip distance, we get an approximate average of 0.65 km distance travelled on Cannon/York for a given trip, and the rest of the distance ridden on other connecting streets.
So far, this considers the entire length of Cannon/York between Ottawa and Dundurn. Let's restrict our analysis only to those trips that touched on the Cannon Cycle Track itself.
Out of the 2,377 trips that touched on Cannon/York, 2,050 trips touched on the cycle track itself. Those 2,050 trips traversed a total of 5,996.47 km.
In addition, 231 trips touched on the section east of the cycle track on Cannon between Sherman and Ottawa, and 533 trips touched on the section west of the cycle track on York between Dundurn and Hess. (The sum is more than 2,377 because some bike trips touch on more than one section.)
The vast majority of trips along Cannon/York - 86.24 percent of the total - touched on the cycle track. However, the cycle track section is much longer than the sections to the east and west, so we need to control for the variance in length.
Even when we control for length, the cycle track had a higher rate of use than the bike lanes on either side. The cycle track section had 621.2 trips per kilometre, the east section had 135.9 trips per kilometre, and the west section had 533 trips per kilometre.
| Section | Distance | Trips | Trips/Km |
|---|---|---|---|
| East | 1.7 | 231 | 135.9 |
| Cycle Track | 3.3 | 2050 | 621.2 |
| West | 1.0 | 533 | 533.0 |
| Total | 6.0 | 2814 | 469.0 |
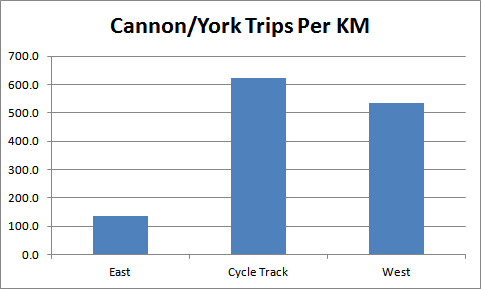
Chart: Cannon/York Trips Per KM by Section
It is possible that this discrepancy in usage may be related to the different cycling infrastructure designs. The eastern section is just painted bike lanes with a gap between Sherman and Lottridge, the central section is physically protected two-way cycle track, and the western portion is space-buffered painted bike lanes.
Another likely contributing factor is the density of Bike Share stations along and around the study area. East of Wentworth Street North, the density of stations falls significantly compared to farther west.
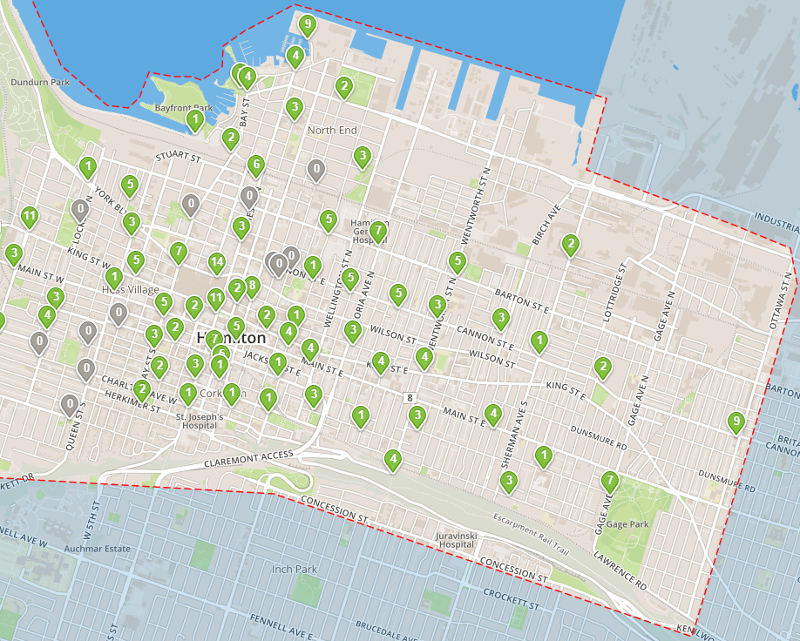
Map: Bike Share stations between Dundurn and Ottawa Street (Image Credit: Hamilton Bike Share)
An "Everyone Rides" initiative was proposed last year to add another 5-7 hubs and 75-125 bikes to serve the east end of the network, but funding for that proposal has not yet been approved.
Hamilton Bike Share has applied to the Green Municipal Fund from the Federation of Canadian Municipalities for partial funding, contingent on matching funds from the City of Hamilton. They expect to find out whether the grant has been approved within the next couple of weeks.
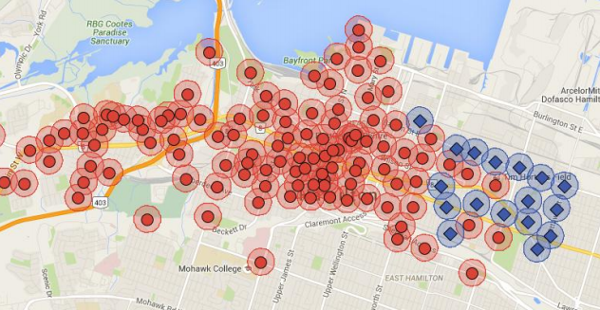
Map of existing hubs (red circles) and proposed Everyone Rides hubs (blue squares) (Image Credit: City of Hamilton)
Among the 2,050 trips that touched on the cycle track, the average distance travelled was 2.93 km (the longest distance was 26.83 km). If we group the trips in half-kilometre buckets by total distance, we can see a flattened, right-skewed bell curve with a median around 1.5-2.0 km.
| Distance | Trips | % of Total |
|---|---|---|
| 0.0-0.5 | 69 | 3.37% |
| 0.5-1.0 | 210 | 10.24% |
| 1.0-1.5 | 311 | 15.17% |
| 1.5-2.0 | 317 | 15.46% |
| 2.0-2.5 | 312 | 15.22% |
| 2.5-3.0 | 222 | 10.83% |
| 3.0-3.5 | 139 | 6.78% |
| 3.5-4.0 | 108 | 5.27% |
| 4.0-4.5 | 74 | 3.61% |
| 4.5-5.0 | 50 | 2.44% |
| 5.0+ | 238 | 11.61% |
| Total | 2,050 | 100.00% |
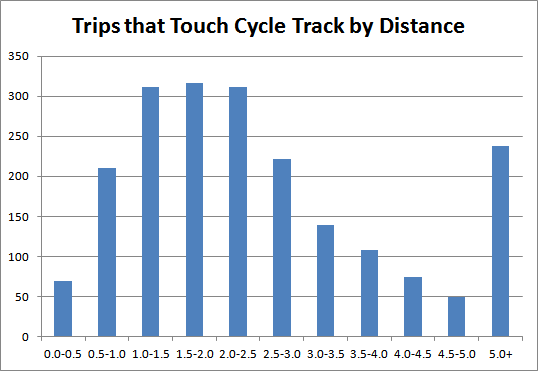
Chart: Trips that Touch Cycle Track, Grouped by Total Distance
The most common total distance was between 1.0 and 2.5 km, with 940 trips or 45.85 percent of the total falling within one of those groups and an elongated tail for higher distances.
That average total distance of 2.93 km includes the entire trip, not just the portion of the trip on Cannon. We can further restrict our analysis further to just those portions of the trips that touched on the Cannon Cycle Track.
Of the GPS points for these 2,050 trips, 18.66 percent fall within segments along the cycle track. There is not an exact correlation between two sets of GPS coordinates and a specific unit of distance, but it can serve as a rough approximation.
If we take that 18.66 percent of the average 2.93 km trip distance, we get an approximate average of 0.55 km distance travelled on the cycle track for a given trip, and the rest ridden on other connecting streets.
We can also group the trips by distance ranges travelled on the cycle track. This shows clearly that the majority of trips traverse only a short distance on the cycle track.
| Distance | Trips | % of Total |
|---|---|---|
| 0.0-0.5 | 1343 | 65.51% |
| 0.5-1.0 | 282 | 13.76% |
| 1.0-1.5 | 177 | 8.63% |
| 1.5-2.0 | 91 | 4.44% |
| 2.0-2.5 | 97 | 4.73% |
| 2.5-3.0 | 24 | 1.17% |
| 3.0+ | 36 | 1.76% |
| Total | 2050 | 100.00% |
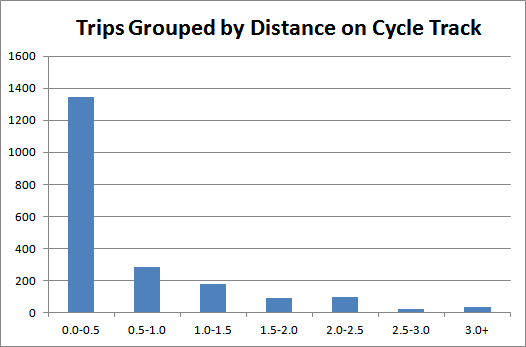
Chart: Bike Share trips grouped by distance on cycle track
Of the 2,050 trips that touched the cycle track, 1,343 (65.51 percent) spent less than 0.5 km on the cycle track. Another 282 (13.76 percent) spent between 0.5 km and less than 1 km on the cycle track. Only 248 trips (12.1 percent) spent more than 1 km on the cycle track.
Another way to look at the results is to group the trips by number of blocks traversed on the cycle track. Again, this shows very clearly that most trips spend only a short distance on the cycle track.
| Blocks | Count | % of Total Trips |
|---|---|---|
| 1-5 | 1380 | 67.32% |
| 6-10 | 238 | 11.61% |
| 11-15 | 172 | 8.39% |
| 16-20 | 81 | 3.95% |
| 21-25 | 90 | 4.39% |
| 26-31 | 72 | 3.51% |
| 32 | 17 | 0.83% |
| Total | 2050 | 100.00% |
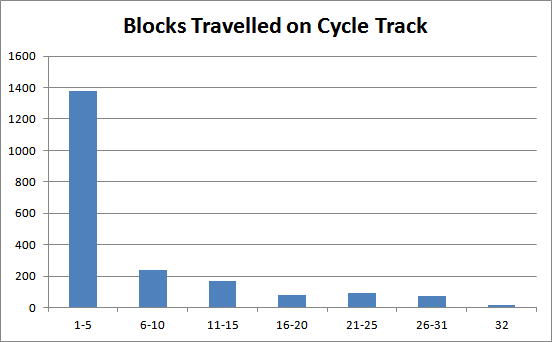
Chart: Bike share trips grouped by blocks traversed on cycle track
Of the 2,050 trips that touched the 32-block cycle track, 1,380 trips, or 67.32 percent, only traversed 1-5 blocks. Another 238 trips, or 11.61 percent, traversed 6-10 blocks, and 172 trips, or 8.39 percent, traversed 11-15 blocks.
Just 81 trips (3.95 percent) traversed 16-20 blocks, 90 trips (4.39 percent) traversed 21-25 blocks, and 72 trips (3.51 percent) traversed 26-31 blocks.
Only 17 trips (0.83 percent) actually travelled the full 32 blocks of the cycle track.
There are five bike counters on the Cannon cycle track: two at the west end, two at the east end and one in the centre. Of the 2,050 Bike Share trips that touched on the cycle track, only 955 (46.59 percent) touched on a segment that contained a bike counter.
This is not necessarily a measure of trips that crossed the counter, but rather of trips that touched a block with a counter, so it may slightly overstate the number of trips that would have triggered the counter.
Those 955 trips were an average of 3.55 km in distance, slightly longer than the average distance of all trips that touched on the cycle track. Grouped by distance, we see a normal distribution with the median distance at 2.0 - 2.5 km and an elongated tail for higher distances.
| Distance | Trips | % of Total |
|---|---|---|
| 0.0-0.5 | 21 | 2.20% |
| 0.5-1.0 | 41 | 4.29% |
| 1.0-1.5 | 85 | 8.90% |
| 1.5-2.0 | 120 | 12.57% |
| 2.0-2.5 | 171 | 17.91% |
| 2.5-3.0 | 112 | 11.73% |
| 3.0-3.5 | 80 | 8.38% |
| 3.5-4.0 | 71 | 7.43% |
| 4.0-4.5 | 53 | 5.55% |
| 4.5-5.0 | 37 | 3.87% |
| 5+ | 164 | 17.17% |
| Total | 955 | 100.00% |
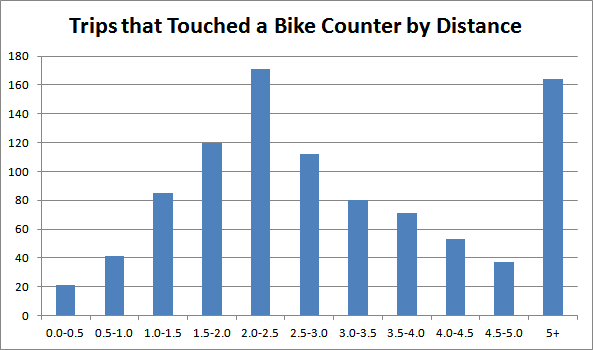
Chart: Bike Share Trips on Cannon Counters Grouped by Distance
Of the 955 trips that touched a block with a bike counter, 403 trips (42.2 percent) were a distance between 1.5 and 3.0 km.
To the extent that the pattern of Bike Share trips is a reflection of bicycle use more generally, this suggests the City's bike counters are missing more than half of the bike trips that use the Cannon cycle track.
The clear conclusion is that most Bike Share trips that touch on the Cannon cycle track do so for only a short distance as part of a route between origin and destination.
The average trip was 2.93 km in total distance, with around two-thirds of trips only spending less than 0.5 km on the cycle track. Put differently, around two-thirds of trips only travelled 1-5 blocks along the cycle track. Less than one percent of the cycle track trips studied in this sample actually traversed its full length between Sherman and Hess.
The typical Bike Share rider on Cannon is not using it as an east-west thoroughfare, as might naively be assumed, but rather is using it for short trips as a local collector street between nearby micro-destinations.
This has significant implications for how the City measures the usage of the cycle track. Of the 2,055 trips that touched the cycle track, only 955 touched a block that contained a bike counter, which means the city's bike counts are missing more than half of the bike trips that use the cycle track.
To the extent that the pattern of trips on Cannon for Bike Share users is similar to the pattern of trips on Cannon for other bicycle riders, this means we need to consider the impact of this information on how we design, implement and measure cycling infrastructure.
If it turns out to be correct that people are using streets differently when they ride bicycles than when they drive automobiles, we need to make sure we're not letting an automotive perspective dictate the way we build and evaluate the cycling network.
There is also some evidence to suggest that the protected cycle track may be enjoying a higher rate of use than the unprotected bike lanes on either side, though this hypothesis requires more study.
Generally, the evidence from other cities is that protected cycling lanes are better at attracting people to choose cycling than unprotected painted lanes, so we should definitely give this more consideration.
We should be making cycling infrastructure design decisions based on the goal of maximizing the number of people who will use the infrastructure once it is built. This goal not only ensures that bike lanes will be useful to more people, but also ensures that the allocation of scarce public right-of-way (and capital/operational resources) delivers the biggest return on the investment.
So it is encouraging to learn that the City of Hamilton plans to incorporate bike share data into its bike traffic analysis. According to Mr. Bender, "We plan to further develop this data by marrying SoBi data with counts at specific locations - just as you have done."
Update: The City has provided bike trip counts at four locations on Cannon Street. You can jump to the changed paragraph.
Update 2: the list of bike counters is slightly different from the counters on the city's map. The bike counter map and text has been updated to reflect the current locations of the bike counters. You can jump to the changed paragraph.
Update 3: Alternative Traffic Project Manager Daryl Bender stated that the City intends to incorporate bike share data into its bike traffic analysis. You can jump to the added paragraph.
By interr0bangr (registered) | Posted August 10, 2016 at 14:28:19
I use the bike lanes everyday but my route doesn't touch any of the counter locations.
By Core-B (registered) | Posted August 10, 2016 at 15:11:56
As ^ the vast majority of my trips on the cycle track are within (not touching) the counters. Question: The original plan called for counters just west of Sherman. The last time I went east (a few weeks ago), there were no counters installed. Are they now in place?
Oh and shame on me for forgetting to say what a fantastic detailed report. Thank you.
Comment edited by Core-B on 2016-08-10 15:13:27
By KevinLove (registered) | Posted August 11, 2016 at 08:44:00
Ryan,
Thank you for a fantastic report. I would like to suggest that SoBi bike share trips are actually longer on average than trips on private bicycles. This would further reduce the percentage of trips captured on Cannon by the counters.
Why do I assert that SoBi bike trips are longer than average? For example, consider where I live, on Park Street just south of Herkimer. If I want to take a SoBi bike, I have to either walk west all the way across Durand Park to the SoBi station on the west side of Durand Park. Or I have to walk east all the way over to James Street to the SoBi station there.
The same is true of most of the destinations to which I am going. There is rarely a SoBi station right outside my destination. I have to walk to/from the SoBi station.
For most destinations in downtown Hamilton, I would spend as much or more time walking to and from the SoBi stations as I would actually riding the SoBi bike to get to where I am going. But I can get on my private bike right at home and go straight to my destination.
So for shorter trips I walk instead of taking SoBi bike, because walking is faster than SoBi. I suspect that most private bike owners take those short trips on their private bikes, and most SoBi users walk for those short trips.
So I conclude that the mode share for private bikes vs. SoBi for short trips is much higher than for long trips. And in turn, that means that the counters on Cannon Street are missing even more bike trips than estimated by Ryan in his article.
By matthewsweet (registered) | Posted August 11, 2016 at 10:10:38
Excellent analysis, in particular showcasing the potential of Sobi data as a check against traditional traffic count methodology for bicycle infrastructure. But the key lesson is to reinforce the point that trip making behaviour (distance, purpose etc) vary wildly based on mode of transportation. Measuring techniques must attempt to address that difference. I would strongly suggest that this article make the rounds inside and outside of Hamilton, and quite frankly into the traffic engineering world as well. There are potential ramifications in terms of cycling infrastructure and network planning, design, operations and on and on.
By kevlahan (registered) | Posted August 11, 2016 at 11:39:12
Interestingly, the advent of SoBi means that we now have much more detailed and solid data on bike movements than car movements for a relatively large proportion of all cyclists!
For years there has been a debate about how much traffic is cut through (e.g. on Main St from the 403 to QEW across the lower city, to take an extreme example, or in local neighbourhoods). There are also questions about how much extra travel time/distance the one way system causes for motorists trying to navigate to destinations within the one-way grid (wards 1-3).
We can't answer these questions definitively because we don't have routes or even origin/destination data for cars, all we have are rarely done intersection counts and google maps indications of how busy certain streets are at different times of day.
Comment edited by kevlahan on 2016-08-11 11:39:39
By mdrejhon (registered) - website | Posted August 15, 2016 at 07:18:18
I have captured several different 10-minute video clips at Wellington & Cannon for the purposes of counting cars, bikes, and pedestrians.
I counted only bikes that passed a specific point on the road. In the various different videos, Bike ratios varied dramatically from ~0.1 through ~0.45 (count of bikes divided by count of cars/trucks). The equality ratio is 0.33 where you have 1 bike for every 3 cars -- given the cycle track uses 1 car lane out of 4. So anytime the bike ratio went above 0.33 (more than 1 bike for every 3 cars), the lane was actually outperforming cars at that section. In a few years this probably will happen a lot more consistently.
Another observation that struck me was the surge of cars (via stoplight) is often accompanied by a long quiet moment often lasting 60-90 seconds. Where the bikes were far more evenly spaced out. When driving, it does give the illusion the cycle lane is not being used very much, but if you stand roadside long enough, you actually notice -- and anecdotes by residents who live on Cannon also support this as well.
One thing I noticed is that many bikes went onto the cycle track for a few blocks, then went off. There are clearly many people who were going north-south, and using the cycle track for an east-west hop.
Quirkily, I still see cyclists on the sidewalk and on the road, possibly because of the bumpiness of Cannon. Some old habits die hard, and those bikes are clearly not counted. I would suspect that Cannon cycle track usage would actually go up further once the City has their planned repaving of Cannon (I read it was scheduled for some year between now and 2020, IIRC -- I can't find the documentation)
Now, for the observation I will discuss the most about: Motorized users in cycle track.
Another thing I noticed is that a very, very significant number (~10% of cycle track traffic) of scooter-type bikes/vehicles/wheelchairs (some with those emergency pedals) use the cycle lanes. And some high-speed electric wheelchairs too. At the usage levels currently, it is low enough that I don't see concern with these yet, but when the lane eventually hits more frequent bike congestion, laws may need to be revisited (note: there's a distinction between pedelecs (regular bikes with electric assist) and scooter-type ebikes with pedals, and scooter vehicles with no pedals.
Normally I have mixed feelings about motorized vehicles using the Cannon Cycle Track, but it seemed okay within reason such as scooter mobility aids, at the current cycle track usage density levels. It didn't seem to be a yet a concern at this stage as there's still room in this growing on-street cycle track. The sidewalks can admittedly be rather narrow, and pedestrians had more room with the scooter assistive mobility users using the Cannon cycle track, so there are safety pros/cons for all road/sidewalk users, with win-win scenarios... Also cycling on the lanes, I've had to pedal behind motorized vehicles, and then pass them when safe to do so. It was no more difficult than just simply passing a slow or medium-speed bike. They tend to be more predictable as they don't weave back-and-fourth as an unsteady cyclist. This helps passing comfort. So I didn't yet see increased safety concern as a cyclist as long as these vehicles are not high speed. As usage increases, and new danger cases arises as a result (larger number of kids + bike congestion), it probably will need to be revisted what types of motorization is allowed at what speed limit...
Over all, it was about 10% of Cannon cycle track traffic that probably also counted the mobility aids/scooters/e-bikes -- including disabled, elderly, scooter enthusiasts, low-speed e-bikes. They seemed clearly attracted to, and accommodated by, the Cannon cycle track infrastructure. None of these vehicles went very fast (the motorcycles and the fast scooters were on the road instead).
(Currently I'm not sure what Hamilton's laws on in the use of motorization within on-street bike lanes, barriered or otherwise. Anyone to confirm? Based on my impression.
What I have seen so far is mostly okay for street-level cycle lanes and cycle tracks (of the Cannon type), e-bikes (with pedals!) seem okay on road-surface bike lanes when it comes to City of Hamilton (long being a motor-friendly town). Plus also mobility aids for the disabled that are capable of going medium-bike-speed, far faster than safe for sidewalks. So I don't think it would be fair to ban them from Cannon lanes.
Just wondering where the line needs to be drawn in the future (e.g. we don't want high-performance electric motorcycles using the Cycle lanes).
I think it boils down to a speed issue. A blanket motorization ban definitely makes no sense.
My assessment is this: Low-speed legal mobility aids (like basic electric wheelchairs that cannot go fast) should go on sidewalk. Medium-to-fast speed mobility aids should be allowed to transfer to on-street cycle lanes, for faster mobility, as long as they do not impede bike traffic. Pedelecs (i.e. regular bicycles with electric uphill assist from a small motor/battery) should be allowed anywhere bikes can go as long as speed-capped, even off-street bike paths. Small scooter-type ebikes with emergency-use pedals may be allowed on street-surface bike lanes and Cannon cycle track (up to X kph limit), but not off-street bike paths. Electric motorcycles, the ones capable of full car speed and highway speed, are banned from all cycle lanes and cycle tracks. Etc. Some laws in other cities follow roughly this categorization.
Obviously, this is just an opinion, and it's actually in law in some cities that permits certain levels of electric motorization on road versus cycle infrastructure, and sometimes more permissively for disabled (e.g. disabled scooter plate), given the need to accommodate disabled/mobility users that use scooter-type aids that can speed up to speeds unsafe for sidewalks, but not safe for mixing with car traffic, and falls into cycle infrastructure fitting these certain disabled users the best, whenever they're going maximum speed of their electric scooter mobility aid.
I'm looking forward to the continued improvement of cycle infrastructure. As cycle infrastructure booms, motorization usage rules may need to be clarified (in a fair and equitable way) based on the boom of mobility-aid users I'm noticing.
Comment edited by mdrejhon on 2016-08-15 08:16:19
By mdrejhon (registered) - website | Posted August 15, 2016 at 09:56:40 in reply to Comment 119795
Timely, I found a YouTube video on mobility aids using cycling infrastructure:
VIDEO: Who else benefits from the Dutch cycling infrastructure
Some North American cities appear ban mobility aids entirely from on-street cycle infrastructure -- and redirect them to the sidewalk -- due to concerns about safety with cars -- but the Dutch seem to have chosen a good compromise over there -- it is an interesting watch.
Comment edited by mdrejhon on 2016-08-15 09:59:14
You must be logged in to comment.
There are no upcoming events right now.
Why not post one?