To achieve its full potential, LRT must be implemented in conjunction with supportive land use and transportation policy.
By Kathleen Pereira
Published March 14, 2017
The city of Hamilton is growing with the rest of the Greater Toronto and Hamilton and will eventually reach costly levels of congestion unless a proper plan is put into action soon. This inquiry paper explores whether the proposed LRT system will be a good solution for a growing Hamilton, using the primary sources of reports from the city of Hamilton, crown corporation Metrolinx, and the McMaster Institute of Transportation and Logistics.
It was discovered that LRT is simply a tool to drive and shape transit oriented development, a modal shift away from driving, and the change of land use in preparation for high concentration and flows of people. The city of Hamilton currently does not have an emphasis on making other modes of transportation competitive with driving, although there are efforts towards facilitating transit oriented development.
The city of Hamilton is part of Canada's fastest growing urban region, the Greater Toronto and Hamilton Area (GTHA). Hamilton itself is projected to see population growth that will soon push the limits of the current public transportation network. This issue must be acted on as soon as possible to prevent costly future congestion problems.
Redesigning the transportation mechanics of a city tend to be time consuming, expensive, and disruptive to implement. However, a city with efficient and reliable circulation has many benefits toward economic growth and sustainable development.
Hamilton is choosing to move forward with an 11 km Light Rail Transit line (LRT) supported by a $1 billion capital investment from the crown corporation Metrolinx, with proposed future additions (City of Hamilton 2017).
Hamilton's economic success in the late 1800s and 1900s was deeply tied to the manufacturing industry, due to the city's strategic location close to the border of the United States of America in addition to relatively inexpensive electricity [Freeman 2001, 155].
The arterial one-way streets were implemented in 1956 as a means of reducing congestion caused by the commute of industry workers [Freeman 2001, 155]. Their similarities to fast-paced highways caused stagnation in the downtown core. The eventual decline of the manufacturing industry and the shift of Hamilton's economy to a service and knowledge based one today have produced new travel patterns in the city.
Hamilton is growing in both population and in jobs. The relatively low property prices and proximity to Toronto have made the city more attractive to live in.
Despite the past decline in the downtown core, it is now seeing growth and is on an economic incline. With the steadily growing population, the current transportation network needs changes to support increased numbers, promote growth of the downtown core, and the intensification of high traffic areas in the city.
Thus, as a method of facilitating population growth, it is important that the new LRT routes are planned with careful consideration of several economic, environmental, and social factors. This inquiry therefore investigates the following central question:
Is the planned coverage of the Light Rail Transit system likely to be a successful design for a growing Hamilton?
The Growth Related Integrated Development Strategy (GRIDS), initiated by the City of Hamilton in 2003, analyses many aspects of Hamilton and offers advice on planning for the next 30 years. Hamilton reached 536,917 people in 2016, whereas the GRIDS report projected about 560,000-570,000 by this time (Statistics Canada 2016) (GRIDS 2006, 6).
Compared to the 2011 population of 519,949, the city is indeed growing, although perhaps at a slower rate than the past predictions show (Statistics Canada 2016). Growth forecasts show that the population may increase to 660,000 by 2031 (GRIDS 2006, 6). The entire GTHA area is also expected to increase from 6.95 million in 2016 to 8.6 million in 2031 (Metrolinx 2010, 3), which supports an additional need for stronger transit interconnections between cities.
The GRIDS study was done prior to the commitment to rapid transit in Hamilton. However, its findings on the need to adjust and allow for sustainable growth remain relevant today.
The cost of living is cheaper in Hamilton than Toronto, an attractive prospect for residents and businesses when property prices continue to rise (Statistics Canada 2016). Canada Bread and Maple Leaf Foods are two examples of large companies that closed plants in Toronto and other cities to come to Hamilton (Kalinowski 2007).
Hamilton continues to see growth through immigration as well. Just under 15,000 immigrants arrived between 2006 and 2011, and almost 25 percent of the city's population were immigrants in 2011 (Statistics Canada 2011). This is slightly lower than the provincial average around 28 percent.
Jobs are also growing in the downtown core, with over 1000 new jobs between 2015 and 2016, the largest increase in the past seven years. This puts the job density at about 189 jobs per hectare, nearing the city's target of 250 (Rennision 2017).
The city has put efforts toward the revitalization of the downtown, such as a number of incentives to stimulate private sector investment and redevelopment (City of Hamilton 2016). These include financial assistance for conversion of commercial space to residential, attracting new office tenants, and the expansion of existing businesses.
After World War II, the Hamilton mountain area saw the most growth. Manufacturing workers would commute from their homes on the mountain across the city to their jobs that were closer to the waterfront of Lake Ontario. The major one-way streets in Hamilton were constructed in 1956 as a response to commuters' complaints of congestion, including King Street, which is still a one way artery today (Freeman 2011, 155).
By 1960, the downtown started to decay as the highway-like one-way streets facilitated longer trips across the city (Freeman 2011, 165). However, the mountain area continued to see growth for many years and Hamilton became a place that was very easy to drive in (Freeman 2011, 170).
The manufacturing industry that once brought Hamilton economic success saw its decline as the economy moved from manual workers to more skilled ones, in addition to competition with American imports (Freeman 2011, 178). Between 1981 and 1996, the number of manufacturing jobs halved to about 32,000.
The service sector eventually replaced many of the jobs that had been lost. In 2011, health care and social assistance was the top industry for the employed labour force at 13.4 percent of all workers. The next top industries were manufacturing (12.2 percent) and retail trade (11.6 percent) (Statistics Canada 2011).
Since Hamilton's economy has diversified, the one-way streets no longer enhance the most popular travel patterns throughout the city. Instead, they are hindering the growth of the city along these streets and inside the downtown.
The nearby city of Toronto shows the negative impacts from traffic congestion. A 2017 study done by the Canadian Automobile Association (CAA) shows that a vehicle commuting to and from Toronto spends about 36 extra minutes per day during peak hours, resulting in the worst delay out of all the major Canadian cities (CAA 2017, 26).
The Toronto Transit Commission (TTC), the local transit service, regularly sees overcrowding on bus and streetcar routes that is consistently worse than the TTC's overcrowding standards (Spurr, Ben). Therefore, future population growth will no doubt stress the current infrastructure.
A Metrolinx study put the 2006 price of congestion in the GTHA at $3.3 billion along with $2.7 million in lost opportunities for economic expansion (Metrolinx 2008, 1). Hamilton has the chance to mitigate a future similar to Toronto, while the congestion levels are low.
Hamilton Street Railway (HSR), the local bus transit company, sees regular overcrowding during the afternoon peak period service. About ten percent of all buses on the King, Barton, University, Cannon, the B-line, Upper Wentworth, and Mohawk bus routes are over capacity from 3pm to 7pm (IBI Group 2010, 5). Around 740 buses per month are also forced to pass by stops when they are too full (Van Dongen 2016).
Since its one-way streets make Hamilton easy to regularly drive in, a population increase means an increase in drivers. In 2011, 83.4 percent of employed Hamiltonians used a car, truck, or van either as a driver or a passenger to get to work, versus 78.6 percent of all Ontarians (Statistics Canada 2011).
If this continues, the levels of traffic will eventually reach unsustainable levels, no matter how well the roads have been designed to handle traffic.
Hamilton had 426 km of cycling infrastructure in place for travelling across the city and in the downtown core, including bike lanes, on-street signed routes, paved shoulders, and shared on-street routing (see figure 1) (City of Hamilton 2010, 11) (City of Hamilton 2017). 0.8 percent of employed Hamiltonians cycled to work in 2011, below the provincial average of 1.2 percent, whereas 4.9 percent walked and 9.8 percent took public transit, both also under the provincial average (Statistics Canada 2011).
The city has projects in motion to add bike lanes and paths to several streets, with a list of many more streets that are planned for the addition of cycling infrastructure that is intended to create a shift away from driving (City of Hamilton 2017). SoBi Hamilton, the nonprofit bike share company in the city, has seen growth since it first appeared in early 2015 (Benett 2016).
The dedicated bike lanes on Cannon street are an example of a best practice situation when it comes to cycling in the city. The street saw 500 to 600 trips per day in the summer of 2015, one year after implementation (Carter 2015). However, cycling as a whole is simply not reliable year-round due to the major drawbacks of wintertime unreliability, small carrying capacity, and exposure to the elements.
Safety concerns are also an issue due to the proximity to cars. The Cannon bike lanes saw an increase in collisions in 2015 - though ridership had also increased significantly, as previously mentioned. The city explained that most of the collisions were due to cyclists not obeying the rules of the road along with a few drivers that did not give right of way to bicycles.
Cannon Street shows how transport by bicycle and car can exist harmoniously, although an emphasis on education for motorists and cyclists about the rules of the road could further improve this situation.
")
Figure 1: Bike lanes, routes, and trails in Hamilton (Smart Commute 2017)
The original design included an east-west line and a north-south line, covering approximately 35 km, pictured in figure 2 below.
")
Figure 2: Original proposed rapid transit corridors (Mackenzie 2008)
The $1 billion in approved funding is for a much smaller coverage, with no LRT for the A-line and a B-line that stops at the Queenston circle. The future extension from Queenston to Eastgate Square is currently in development, but construction is not planned as of yet (see figure 3). A portion of the A-Line was previously considered for LRT, however this has since been changed to 16 km of BRT.
 with LRT B-Line")
Figure 3: Proposed BRT A-Line (in purple) with LRT B-Line
This primary stage of the LRT project involving the A and B Lines represents part of the city's long term plan for a complete rapid transit network, called the 'BLAST' network (figure 4). It is intended to facilitate transportation within the city, and just as importantly, connect Hamilton to GO Transit and nearby local transit companies.

Figure 4: Hamilton's long term rapid transit plan for the 'BLAST' network
Former Ontario Premier Dalton McGuinty's original proposal of two rapid transit lines for Hamilton was the main event that set the stage for serious discussion on rapid transit in Hamilton.
In the years afterwards, a number of reports were created by Metrolinx and the city of Hamilton in order to assess the feasibility of Light Rail Transit and discover what factors would be necessary to consider during planning (such as environmental assessments, public consultation, and land use studies).
2007 - Premier Dalton McGuinty proposes two rapid transit lines for Hamilton as a part of MoveOntario2020, a plan to fund 52 rapid transit projects in the GTHA
2008 - Council votes to pursue LRT with full provincial funding of capital costs, and public consultation begins (and continues into 2011)
2009 - $3M is received from Metrolinx (Ontario government) for the design, planning, and engineering of the B-Line and feasibility study for the A-Line
2010 - Metrolinx Benefits Case Analysis (BCA) shows a phased LRT system as having a better economic impact than BRT
2011 - Land use study completed for corridors and nodes along the A and B-Lines
2013 - The city releases a formal request for funding, the Rapid Ready Report
2015 - Province Ontario announces up to $1 billion in funding for Hamilton
2016 - Agreement signed between the city and Metrolinx outlining each party's responsibilities to implement LRT
Metrolinx's 'MoveOntario 2020' plan represents the Ontario government's original commitment to fund $11.5 billion towards 52 rapid transit projects in the GTA, with a request for an additional $6 billion from the government of Canada (Kalinowski 2007).
The successor to MoveOntario 2020, The Big Move, outlines Metrolinx's implementation plan for the 52 proposed projects and explicitly outlines some of its main goals through improved transportation: reducing urban sprawl, reducing emissions, more pedestrian friendly streetscapes, prosperity in the Ontario region, multi-modal integration, and interconnectedness within the GTHA and to outside of it (Metrolinx 2008, 13).
Two rapid transit lines were proposed for Hamilton: one north-to-south and one east-to-west line. Bus Rapid Transit (BRT) was initially the most popular option due to the low capital costs versus a typical LRT system. With the capital costs no longer an issue due to government funding, LRT became a serious contender with the BRT.
Ultimately, the Benefits Case Analysis performed by Metrolinx in 2009 put the LRT on top, with dedicated two way lanes at the median of the existing streets. The BCA indicated that Light Rail would cost the most but also offer the most economic benefit to the city.
An important point that Metrolinx stated in their report is that the conversion of Main Street and King Street from one way to two way is assumed in the three scenarios they analysed: 1) Full BRT, 2) Full LRT, and 3) Phased LRT (Metrolinx 2009, 6).
This conversion significantly lowers costs since less Light Rail infrastructure is required, creates less disruptions by construction by only affecting one corridor, and improved accessibility for riders - especially since Main and King are not just a few steps away from each other throughout the entire B-Line (Metrolinx 2009, 20).
The 2010 Metrolinx Benefits Case Analysis outlines the main objectives for the LRT project. They consist of some specific goals and some broader ones listed below. Not only does Metrolinx seek to improve transport around the city as the population grows, it also wants to promote economic, environmental, and social development.
There is a clear theme of supporting intensification and inducing a modal shift away from driving through rapid transit (Metrolinx 2010, 16):
Specific objectives
To increase transit ridership
To put pedestrians and transit first in planning the corridor by enhancing the streetscape and creating a more pedestrian-friendly environment
To improve the City's business, tourist and development appeal
To provide effective connections to neighbouring transit systems
Broad objectives
To promote new development and investment along its key corridors and at strategic nodes (GRIDS)
To support opportunities to redevelop and / or intensify existing developments
To support and revitalize existing and future development areas (McMaster University, West Hamilton Innovation Park, Downtown Area including the Central Library, Farmer's Market, Hamilton Art Gallery, Copps Coliseum, potential new stadium etc.) and businesses
Provide a choice of travel modes that support and inter-connect to each other at both a local (trails, cycling, walking) and inter-regional level (GO)
Improve access to key activity centres such as recreation/sporting facilities, arts centre and convention centre
To achieve local and regional environmental objectives
To promote a sustainable community
Based on the background information on the rapid transit situation in Hamilton, a number of educated guesses were made to answer the central question. They serve as a starting point for further investigation - the full findings are outlined in section 3.2 Main Findings.
1. The LRT's route will be successful because the individuals who regularly drive through these corridors wish to take public transport; however, they do not find the current infrastructure suitable to their needs.
It was discovered that Hamilton's road network is optimized for driving, even throughout the downtown core. The plentiful and cheap parking in the downtown area also makes driving more convenient. The HSR suffers from overcrowding during rush hour and a lack of investment from the city despite large fare increases.
In accordance with Metrolinx's Benefits Case Analysis, the implementation of Light Rail along the B-Line corridor will include conversion of one-way streets to two way, the intensification of the downtown as the city is redeveloped, and the anticipation that the amount of available parking will decrease along with an increase in cost (Metrolinx 2010, 12).
2. The LRT will bring more business to the downtown by improving the image of the B-Line corridor.
A typical Light Rail system is more comfortable, attractive, more spacious, and will have more frequent service than the current HSR transit buses.
However, an LRT system is just one factor that can promote growth and revitalisation. It will only be able to reach its full potential once it is used in conjunction with other factors of growth, especially transit oriented development.
3. Access to the Hamilton mountain areas is not currently critical to a rapid transit network.
HSR Ridership is much lower in the mountain areas, and high density nodes are further apart from each other when compared to those on the B-Line. While Light Rail vehicles can handle the mountain grades, the implementation of infrastructure would be more costly.
The mountain population is growing in population with the rest of Hamilton, so the need for a future A-Line rapid transit line is still relevant. The 16 km of proposed BRT for the A-Line is a good start to add to the city's citywide rapid transit (B-L-A-S-T) concept (figure 4).
The following list of three main findings outline some possible answers regarding the success of the LRT. These statements were derived from the previously stated anticipated findings as more research was completed.
The LRT will help to increase economic activity in the downtown core by improving the image of the B-Line corridor through intensification, transit oriented development, and a more pedestrian-friendly downtown.
Driving is too easy in Hamilton. For the LRT to better reach its potential, a modal shift away from driving needs to occur.
A key factor towards the success of the LRT is the redevelopment of land use near the line into a more high density concept.
The LRT will help to increase economic activity in the downtown core by improving the image of the B-Line corridor through intensification, transit oriented development, and a more pedestrian-friendly downtown.
Minneapolis is an example of a city that correctly utilized transit oriented development to support their LRT system. Through employment growth in the central business district, the demand for high-density residential buildings increased. The city also had their own revitalization efforts in place to attract new development and jobs (Higgins and Ferguson 2012, xi).
With its own programs to revitalise the downtown, Hamilton is seeing job growth of its own as previously mentioned in the background. The city must therefore continue to put effort into attracting jobs to increase the demand for high-density residential establishments, even once the target of 250 jobs per hectare is reached.
High density dwellings are less attractive in current-day Hamilton due to the large amount of space and under-developed land, such as the 19-storey apartment building in Stoney Creek that was rejected for being too tall (Werner, 2017). This extra space, some of which is tied up in parking lots, can be a fresh canvas for transit oriented development. In order to reduce urban sprawl, Hamilton will need to continue building 'up'.
Hamilton's road structure is fairly suited to pedestrians with its square grid layout, although the five-lane one way sections with cars regularly travelling over the speed limit disrupts pedestrian flows (Higgins et al. 2015, xiv). Making the streets more pedestrian-friendly gives way to the idea of 'Complete Streets' and multi modalism that plans for all road users to have safe, accessible routes (Higgins et al. 2015, 6)
Driving is too easy in Hamilton. For the LRT to better reach its potential, a modal shift away from driving needs to occur.
The B-line sees about 40 percent of all ridership in the entire HSR network (IBI Group 2010, 32). Therefore, like most cities, it is unsurprising that rush hour on this route means packed buses. What seems to bring dissonance among commuters is the number of full buses that pass by a stop without letting anyone on.
In spring 2016, the HSR saw a monthly rate of about 740 buses per month that were too full to stop (Van Dongen 2016). This results in decreased reliability of the system and a poorer perceived image.
Few riders are ever happy to see fare increases. The current fare for an adult paying cash is $3.00, with the last fare hike effective in September 2016. Prices were increased in order to provide better service to riders. However, overall ridership was declining in recent years.
Despite the HSR charging less than most of the local transit companies in the GTHA, the fare hikes appear to reduce ridership. The average income in Hamilton is not increasing quickly enough for commuters to cope (Van Dongen 2016).
The benefits from fare increases are also not seen quickly enough by riders in Hamilton, unlike the Miway system in Mississauga. MiWay has gone through fairly frequent fare hikes, increasing from $3.00 in 2011 to $3.50 in 2016 (MiWay 2011). The improvements from these hikes have been made apparent in the constant increase of service, new or improved routes, and new vehicles. Ridership and service have been increasing when compared to the HSR levels (MiWay 2014).
Parking is also abundant, cheap, and not fully utilized downtown, with about 26 percent of downtown area dedicated to parking (Higgins 2015). It costs $1 per hour to park on the street on weekdays from 8am to 6pm versus Toronto's price of about $7 per hour at any time or day. Tying up so much land has reduced the economic potential of the downtown, and reduces the competitiveness of transit (Metrolinx 2010, 12).
Decreasing the amount of parking or raising its price could be a good way to discourage drivers. However, parking lots naturally become candidates for redevelopment as a city's population grows and space runs out. Therefore, there is a likelihood that the parking issue may solve itself.
If the LRT is implemented on the heaviest traffic corridors in the city, then visiting, or even just transferring through the downtown areas will become more convenient due to the increased capacity and frequency. As this is a Metrolinx project, and it will be integrated with the rest of the HSR network, the ease of use will help to retain these riders.
Unfortunately, the city appears to be unsure whether the LRT system will keep cars off the road. There has been discussion about the addition of lanes to streets close to the dedicated LRT tracks, as it is believed that there will be an increase in drivers regardless (Van Mitenburg 2017).
The addition of lanes is undesirable because it reduces the competitiveness of LRT (or biking) with driving, and effectively stops a modal shift away from driving. The property values along the LRT line will see limited increases if access to transit is not competitive (Higgins and Ferguson 2012, viii).
A key factor towards the success of the LRT is the redevelopment of land use near the line into a more high density concept.
Dr. Christopher Higgins of the McMaster Institute for Transportation and Logistics (MITL) accentuated the importance of land use change during a short interview for this inquiry paper (C. D. Higgins, personal communication, February 23, 2017). He commented that either LRT or BRT would perform well as long as the zoning of land along the B-Line corridor would support high density establishments.
Dr. Higgins mentioned the Hiawatha Line in Minneapolis as a similar city to Hamilton that has a successful LRT system due to its relatively small population with strong intensification and transit oriented development efforts (Higgins and Ferguson 2012, xi). Hamilton's zoning bylaws were recently modified with the intention of supporting transit oriented development in accordance with the implementation of LRT.
This revision covers most of the B-Line from McMaster University to Eastgate square, and it offers more flexible bylaws that seek to encourage new development (City of Hamilton 2016).
A literature review that Dr. Higgins co-authored in 2014 identifies the six main factors that enhance the effect of rapid transit investments towards the changing of land use, listed below (Higgins, Ferguson, and Kanaroglou 2014, 100). While these factors are very broad and may have different weightings, they demonstrate the complexity of situations that may affect land use change through rapid transit investment.
Hamilton has or will soon have most of the correct indicators in place to support land use change through rapid transit investment, and now it is up to the city to follow in the footsteps of successful LRT systems like Minneapolis.
Improvement in accessibility - the LRT vehicles have a higher capacity than buses, and offer more frequent service on a dedicated right-of-way with signal priority. Also, given that King St will be converted to a two way street before implementing Light Rail, taking the LRT will be more convenient than the current bus network.
Positive regional economic, population, and employment growth and demand for development - As previously mentioned in section 2.1, Hamilton is growing in population and employment, as is the GTHA as a whole. While the city has financial incentives available to drive development in the downtown core, the notion of NIMBY (Not In My Back Yard) can still be observed. For example, Hamilton councillors rejected a 219 residential unit, 19-storey apartment building in Stoney Creek, citing worries of it being too tall for the area (Werner 2017).
Positive physical conditions in transit corridor and station areas - Hamilton's grid-like street structure downtown is pedestrian friendly, although the five lane one-way streets are not. The current lack of new developments could be an issue in attracting new development, although Metrolinx has acknowledged the need to uplift parts of the B-Line (Metrolinx 2010, 12).
Positive social conditions in transit corridor and station areas - unemployment was down half a percent from 2016 to 2017, median total income is slowly increasing each year, and the crime severity index is slowly decreasing as well (Statistics Canada 2016).
Available land for development and ease of land assembly - Past zoning bylaws were a deterrent for new developments as they were too strict. Many surface parking lots also offer space for new developments, since they cover about 26 percent of total space in the downtown (Higgins 2015).
Complementary government planning and policy - the government shows an alignment with land use change by modifying the zoning bylaws along the B-Line and offering incentives for new developments downtown, but there still needs to be clear direction towards a modal shift away from driving.
The city of Hamilton has many attributes in place that could allow for the LRT system to realize its full potential to service a fast-growing city. What it lacks is the push to make Light Rail competitive with driving in order to shape high-density traffic flows efficiently.
There are also some challenges ahead in allowing transit oriented development to occur uninhibited by individuals that do not want or support a high-density area. Still, the city is growing economically and would benefit in any case from a higher order transit system like Light Rail.
While this inquiry report mainly investigated the design of Hamilton's new LRT system, it is also a study into what makes a good design. Through years of feasibility studies, public consultation, the Metrolinx BCA, the MITL reports, and other assessments, the aspects of the LRT have been thoroughly analyzed and presented as a good fit for the city of Hamilton.
One of the most prominent points is that the LRT is only one factor affecting a city, meaning that it must be used in conjunction with concepts such as job creation and land use change for it to be successful.
Looking at the use of LRT as a tool to plan for growth, there are many complex economic, environmental, and social factors that must all be considered in order to provide a good solution. These three factors are very similar to a three legged stool that would fall over if any leg were to be missing.
Since the world of engineering revolves heavily around design, it is imperative that members of this field study and understand the components that make up a good, sustainable design, and that these components are complex and highly varied in different situations.
Bennett, Kelly. 2016. "SoBi Hamilton, the city's popular bike share, turns 1." CBC. March 20. Accessed March 6, 2017. http://www.cbc.ca/news/canada/hamilton/news/sobi-hamilton-the-city-s-popular-bike-share-turns-1-1.3499753
Carter, Adam. 2015. "Cannon bike lanes turn 1: hundreds of riders, more crashes." Hamilton Spectator. Accessed March 6, 2017. http://www.cbc.ca/news/canada/hamilton/news/cannon-bike-lanes-turn-1-hundreds-of-riders-more-crashes-1.3294522
City of Hamilton. 2010. "Shifting Gears 2009." Hamilton. Accessed March 6, 2017. https://d3fpllf1m7bbt3.cloudfront.net/sites/default/files/media/browser/2014-12-17/cycling-master-plan-chapters-1-2-3.pdf
City of Hamilton. 2016. “Transit Oriented Corridor Zones - Wards 1 to 4”. Hamilton. Accessed March 6, 2017. https://www.hamilton.ca/city-planning/official-plan-zoning-by-law/transit-oriented-corridor-zones-wards-1-4
City of Hamilton. 2017. “Downtown and Community Renewal Community Improvement Plan.” Hamilton. Accessed March 6, 2017. https://www.hamilton.ca/municipal-incentive-programs/downtown-bia-programs/downtown-and-community-renewal-community
City of Hamilton. 2017. “Light Rail Transit (LRT)”. Hamilton. Accessed January 30, 2017. https://www.hamilton.ca/city-initiatives/priority-projects/light-rail-transit-lrt
City of Hamilton. 2017. “Biking & Cyclists”. Hamilton. Accessed January 30, 2017. https://www.hamilton.ca/streets-transportation/biking-cyclists
Davis, Gerry. 2009. “Rapid Transit - Benefits Case Analysis and B-Line Corridor Options - Update - (PW09056) (City Wide).” Hamilton. Accessed January 30, 2016. http://www2.hamilton.ca/NR/rdonlyres/55729CB1-ED85-4063-AD6B-44D4ED1F7CB3/0/May25Item57PW09056.pdf
Dillon Consulting Ltd. 2006. “Growth Related Integrated Development Strategy: Growth Report.” Hamilton. Accessed January 30, 2017 http://www2.hamilton.ca/NR/rdonlyres/B49685D5-CEBF-463A-B2D0-01190AFE06BF/0/GRIDSFinalReport.pdf
Ferguson, Mark R., Christopher D. Higgins, Tom A. Lavery, and Elnaz Haj Abotalebi. 2015. “Shaping Hamilton with Complete Streets”. MITL. Accessed March 6, 2017. http://mitl.mcmaster.ca/reports/MITLCompleteStreets_Report.pdf
Fragomeni, Carmela. 2017. “York, Main must be widened for LRT: project lead.” Hamilton Spectator. Accessed January 12. http://www.thespec.com/news-story/7061893-york-main-must-be-widened-for-lrt-project-lead/
Higgins, Christopher D., 2015. “Downtown Parking and Our Vision for Hamilton”. Raise the Hammer. Accessed March 6, 2017. https://raisethehammer.org/article/2451/downtownparkingandourvisionforhamilton
Higgins, Christopher D. and Ferguson, Scott. 2012. “The North American Light Rail Experience: Insights for Hamilton.” MITL. Accessed March 6, 2017. http://mitl.mcmaster.ca/reports/MITL_LRT.pdf
Higgins, Christopher D., Mark R. Ferguson, and Pavlos S. Kanaroglou. 2014. “Light Rail and Land Use Change: Rail Transit’s Role in Reshaping and Revitalizing Cities”. Journal of Public Transportation, Vol. 17, No. 2. Accessed March 6, 2017. http://scholarcommons.usf.edu/cgi/viewcontent.cgi?article=1040&context=jpt
IBI Group. 2010. “Hamilton Street Railway Operational Review.” Hamilton. Accessed January 30, 2017. Accessed March 6, 2017. http://www2.hamilton.ca/NR/rdonlyres/9D868772-92BE-4A69-B874-42A1081726CD/0/TTRFinalReport.pdf
Jeffords, Shawn. 2016. “Pan Am Games still causing traffic problems.” Toronto Sun. Accessed January 30, 2017. http://www.torontosun.com/2016/07/28/pan-am-games-still-causing-traffic-problems
Kalinowski, Tess. 2007. “A $17.5B transit promise.” Toronto Star. June 16. Accessed January 30, 2017. https://www.thestar.com/news/ontario/2007/06/16/a175btransit_promise.html
Mackenzie, Robert. 2008. “HAMILTON RAPID TRANSIT PUBLIC INFORMATION MEETINGS THIS WEEK.” Transit Toronto. Accessed January 30, 2016. http://transit.toronto.on.ca/archives/weblog/2008/05/05-hamilton_r.shtml
MiWay. 2011. “miFARES.” MiWay. Accessed January 30, 2017. http://www.mississauga.ca/file/COM/BusFares2011.pdf
MiWay. 2014. “2015–2018 Business Plan & 2015 Budget.” Mississauga. Accessed January 30, 2017. http://www7.mississauga.ca/eCity/Budget/img/serviceareas/business-plans/miway-summary.pdf
Metrolinx. 2008. “Cost of Road Congestion in the Greater Toronto and Hamilton Area; Impact and Cost Benefit Analysis of the Metrolinx Draft Regional Transportation Plan.” Metrolinx. Accessed March 6, 2017. http://www.metrolinx.com/en/regionalplanning/costsofcongestion/ISP08-015CostofCongestionreport1128081.pdf
Metrolinx. 2008. “The Big Move.” Metrolinx. Accessed March 6, 2017. https://www.metrolinx.com/thebigmove/Docs/bigmove/TheBigMove020109.pdf
Reilly, Emma. 2011. “$390m Maple Leaf plant brings 670 new jobs to Mountain.” Hamilton Spectator. October 20. Accessed March 6, 2017. http://www.thespec.com/news-story/2220811--390m-maple-leaf-plant-brings-670-new-jobs-to-mountain/
Rejhon, Mark. 2016. “Light Rail Transit Station Needed at Gage Park.” Raise the Hammer, July 4. Accessed March 6, 2017. https://raisethehammer.org/article/3026/lightrailtransitstationneededatgage_park
Rennison, John. 2017. “1,000 more jobs downtown Hamilton: survey.” Hamilton Spectator. Accessed March 6, 2017. http://www.thespec.com/news-story/7072784-1-000-more-jobs-downtown-hamilton-survey/
Smart Commute. 2017. “Hamilton Cycling Network.” Smart Commute. Accessed March 6, 2017. http://smartcommute.ca/hamilton/hamilton-cycling-network-4/
Spurr, Ben. 2016. “Quarter of TTC surface routes regularly exceed crowding standards.” The Toronto Star. Accessed March 6, 2017. https://www.thestar.com/news/gta/2016/11/18/quarter-of-ttc-surface-routes-regularly-exceed-crowding-standards.html
Statistics Canada. 2011. “NHS Focus on Geography Series”. Statistics Canada. Accessed March 6, 2017. http://www12.statcan.gc.ca/nhs-enm/2011/as-sa/fogs-spg/Pages/FOG.cfm?GeoCode=3525005&lang=E&level=4
Statistics Canada. 2011. “NHS Profile, Hamilton, C, Ontario, 2011.” Statistics Canada. Accessed March 6, 2017. http://www12.statcan.gc.ca/nhs-enm/2011/dp-pd/prof/details/page.cfm?Lang=E&Geo1=CSD&Code1=3525005&Data=Count&SearchText=hamilton&SearchType=Begins&SearchPR=35&TABID=1&A1=All&B1=All&Custom
Statistics Canada. 2013. “Census Profile”. Statistics Canada. Accessed January 30, 2017. http://www12.statcan.gc.ca/census-recensement/2011/dp-pd/prof/details/page.cfm?Lang=E&Geo1=FED2013&Code1=35037&Geo2=PR&Code2=01&Data=Count&SearchText=hamilton&SearchType=Begins&SearchPR=01&B1=All&Custom=&TABID=1
Statistics Canada. 2016. “New Housing Price Index, December 2016.” Statistics Canada. Accessed March 6, 2017. http://www.statcan.gc.ca/daily-quotidien/170209/dq170209a-eng.htm
Statistics Canada. 2016. “Focus on Geography Series, 2016 Census”. Statistics Canada. Accessed March 6, 2017. http://www12.statcan.gc.ca/census-recensement/2016/as-sa/fogs-spg/Facts-csd-eng.cfm?GC=3520005&GK=CSD&LANG=Eng&TOPIC=1
Statistics Canada. 2017. “Population of census metropolitan areas”. Statistics Canada. Accessed January 30, 2017. http://www.statcan.gc.ca/tables-tableaux/sum-som/l01/cst01/demo05a-eng.htm
SPRC Hamilton. 2016. “Demographic Shifts: Population growth, forecasts andTargets.” Hamilton’s Social Landscape Bulletin. Accessed January 30, 2017. http://www.sprc.hamilton.on.ca/wp-content/uploads/2016/09/Demographic-Shifts-Population-growth-forecasts-and-targets.pdf
Van Dongen, Matthew. 2016. “Flatlining Ridership. Increasing Fares. Pressure on Taxpayers. What is going on at the HSR?.” Hamilton Spectator, Dec 6. Accessed March 6, 2017. http://www.thespec.com/news-story/7004533-flatlining-ridership-increasing-fares-pressure-on-taxpayers-what-is-going-on-at-the-hsr-/
Van Dongen, Matthew. 2016. “City hall notebook: Report promised on LRT traffic impact in Hamilton.” Hamilton Spectator, August 8. Accessed March 6, 2017. http://www.thespec.com/news-story/6800764-city-hall-notebook-report-promised-on-lrt-traffic-impact-in-hamilton/
Werner, Kevin. 2017. “Hamilton councillors turn down 19-storey apartment development”. Hamilton News. Accessed March 6, 2017. https://www.hamiltonnews.com/news-story/7127877-hamilton-councillors-turn-down-19-storey-apartment-development/
By GWW (registered) | Posted March 14, 2017 at 11:26:16
Correct me if i'm wrong, but is the proposed LRT being run as a 3P project and all that revenue on the LRT line would go the successful 3P operator. Given that close to 40% ( as noted above) of the HSR revenue is along this route,(and probably the most profitable portion) there is a potential serious revenue impact to HSR and the the City of Hamilton, and hence city taxpayers.($15 to$20 million?) I don't recall much discussion on this point in the media, or by the City.
I am not sure how the LRT will impact driving patterns of people beyond a reasonable walking distance of the LRT system. There are a heck of lot people driving because of the nature of the their jobs, or they prefer it. Living in an outlying area like Ancaster, it would make no sense. Many other areas of the City fall in the same practical issue that transit doesn't make much sense. Long term with increases in density along the LRT corridor, this may work, with the revenue slowing increasing for the the 3P operator.
Comment edited by GWW on 2017-03-14 11:28:02
By higgicd (registered) | Posted March 15, 2017 at 16:34:12 in reply to Comment 120906
Re: Revenue - rather than the private company take on revenue risk (e.g. fares and ridership to cover costs), in transit PPPs it is often the case that the public sector pays an 'availability payment' to the operator. This payment sets out minimum service levels that must be met. Assuming we did the same, and we probably will, it will mean all fare revenue is retained by the city with fixed costs paid to the operator to cover operations/maintenance.
By GWW (registered) | Posted March 16, 2017 at 15:33:24 in reply to Comment 120935
Thanks for the comment. So the province is on the hook only for the initial ballpark costs of a billion dollars. Based on your comment, if the operating and maintenance costs exceeds the fare revenue, then the City of Hamilton is on the hook. The HSR roughly only picks up half the costs of operations thru tickets right now. Is there costing out there from any other jurisdictions with respect to operating costs and maintenance of LRT systems?
As a taxpayer, I'm concerned given the Billions blown thru ineptitude by the Provincial Government.
By blatchdk (registered) | Posted March 15, 2017 at 12:08:39 in reply to Comment 120906
In terms of HSR revenue, the B-Line route has the highest revenue, which translates to the least loss. Even the B-Line route operates at a deficit based on fares alone. The HSR stands to lose nothing if they were to simply remove those busses from the road and let LRT run. Where notable changes may appear is in keeping the busses on the road (improving transit infrastructure through the rest of the city) since it will cost more (not as much of a discount to the city from fares) to run the L,S, or T-line.
The impact of the LRT allows busses the HSR currently owns to better service regions outside of the LRT. It also encourages businesses to build along the LRT. It won't immediately solve things for the person who lives in Dundas and works in Stoney Creek, but it will give better options when that person loses their license because of failing health, or eyesight.
Again, regardless of the model, fares for transit do not surpass costs. This is why transit has such a high burden on taxes. But when you compare that burden to road maintenance, it starts to look pretty good.
By Deleted User (anonymous) | Posted March 14, 2017 at 13:31:18
Growth, growth, growth. What about sustainability? Stability? Equilibrium? Growth is what neo-liberals love to push but perpetual growth is an impossibility. Growth is what is spurring climate change and traffic and poverty. Growth has overwhelmingly gone to the 1%. Can we stop with the promises for more growth? Let's get local, small, and sustainable. Growth is a lie perpetuated by the super rich who know they'll reap all the benefits while we're left holding the bag. Perfect example? All the businesses clamoring for a Bay Street stop. They want the taxpayer to fund the stop so they can build condos and make more money.
Also, taking out bike lanes and adding lanes for car traffic so a public-private partnership can run a train down the center of the city for profit is wrong on so many levels I don't even know where to begin. The best part is that the costs to build it are public and the profits remain private. Perfect. There's your 3P right there.
Comment edited by JimC on 2017-03-14 13:32:55
By Haveacow (registered) | Posted March 14, 2017 at 14:46:04
Downtown Toronto as it is presently developed would be impossible without the subway system which started in 1954. You have to start somewhere.
We already see the development blooming in Uptown Waterloo and Downtown Kitchener while its ION LRT line isn't even open yet. They are having a public, "open house" of its first Light Rail Vehicle April 8th, 2017.
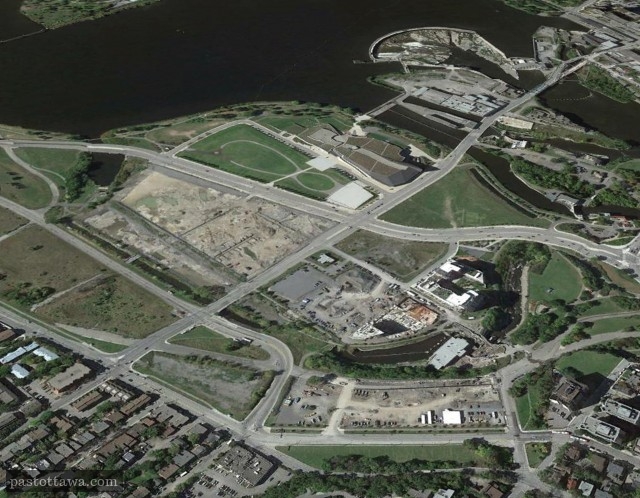
In Ottawa, building the very cheap, diesel powered O-Train (now the Trillium line) in 2001 and converting the Central Transitway (BRT) to the Confederation Line (LRT) has led to a boom in development near the existing Trillium Line stations and future Confederation Line stations in the Lebreton Flats and Bayview areas. The moving of the Senators arena from Kanata to the Lebreton Flats close to the planned Confederation Line's Pimisi station, as well as the other connected developments of the Federal Government's land, adding in the city sponsored developments at the close by Bayview station, which is the meeting place of both the Confederation and Trillium Lines, has lead to a combined $5.3 Billion worth of confirmed development (so far). By 2040 it is expected that the size (in square metres) of the entire central area office and high density residential space of Ottawa will double. The Transitway although very useful in moving a lot of passengers led to very little development in Ottawa (less than $1 Billion over the last 35 years) and spawned little if any development in the Lebreton Flats-Bayview Area located west of downtown Ottawa. It was only when LRT was talked about did talk of development begin increasing in the area.
http://www.pastottawa.com/include/ottawa...
http://www.1310news.com/wp-content/blogs...
(Below) These are the proposed Zibi and Domtar Developments just north of the Lebreton Flats approved after LRT started construction
http://storage.ottawasun.com/v1/dynamic_...
(Below)This is the Canadian Tire Centre superimposed on the existing Lebreton flats site for a local Ottawa website, Westside Action
http://www.westsideaction.com/
https://postmediaottawacitizen2.files.wo...
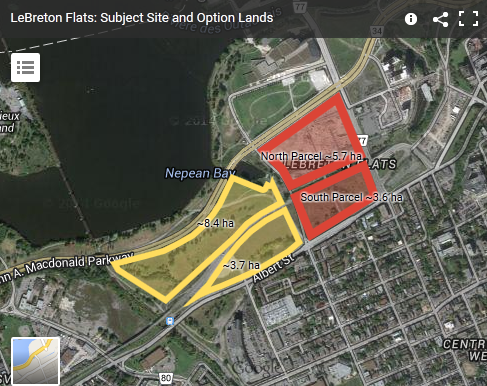
(Below) The chosen Lebreton Site Plan
http://bennettpros.com/MyFiles/Illuminat...
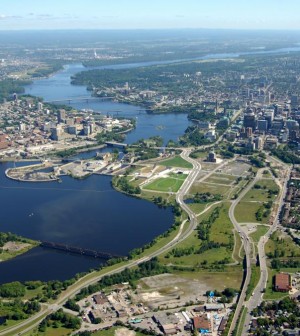
(Below) The entire Lebreton Flats-Bayview station Area, The bayview area is in the foreground while the Lebreton Area is in the back ground
http://ottawaconstructionnews.com/wp-con...
(Below) Picture of the West end of the winning proposal
http://wpmedia.ottawacitizen.com/2016/02...
https://www.bing.com/images/search?view=...
(Below) Bayview Area Development Plan
http://mmmgrouplimited.com/wp-content/up...
http://i0.wp.com/westsideaction.files.wo...
(Below) Bayview Station Rendering, Meeting place of the Confederation (on top) and the Trillium Line (on bottom)
(Below) The view of Carling and Preston from across Dows lake, all buildings are now under construction due to the near by location of the Trillium Line's Carling Station
http://i1.wp.com/www.westsideaction.com/...
Oh yes, there will be a light and sound show, similar to the one that is shown nightly at Parliament Hill on the surface of the Centre Block, open to the public this summer in Ottawa for Canada 150 celebrations, called "Kontinuum" in the concourse level of the new underground Lyon Street Station of the Confederation LRT Line.
The conversion of the Transiway away from buses to LRT trains will also see the city save on its huge transit operating costs. Up to 600 operator and office positions as well as 150 buses will not be needed by the service because of the conversion to from BRT to LRT for just Stage 1 of the system.
I can guarantee the fares of the B-Line LRT in Hamilton will go to the HSR. The Rideau Transit Group who will operate the Confederation and Trillium Lines just receives an operating fee which was part of the final operating agreement, which is determined during the Request For Proposal part of your LRT process. The operating group which wins the RFP process gets that honor. The final number of groups and their content companies, bidding on the operating contract for the B-Line is determined in the during the Request For Qualifications (RFQ) Process for which you will begin very soon in 2017, if they haven't already started.
Relax everybody, this all takes time and is legally required to do so, Hamilton has to start somewhere. You don't start with a completed 100 km+ rapid transit system built overnight, it will take time and effort but the slow process has begun. It will be very difficult and expensive to stop this project now for those at Hamilton's council who seem hell bent on doing just that. The LRT line will happen unless, the province steps in and stops it, which is very unlikely now, regardless of the party in power too much work has been done.
By KevinLove (registered) | Posted March 14, 2017 at 14:47:42
Comment removed by website editor.
Comment edited by administrator Ryan on 2017-03-19 13:03:26
By KevinLove (registered) | Posted March 14, 2017 at 14:50:26 in reply to Comment 120911
Dang. I see that upon posting, all my nicely numbered points were renumbered starting at 1 with each paragraph. And some carriage returns did not come through. Perils of composing in Word...
By AlHuizenga (registered) | Posted March 15, 2017 at 08:35:05 in reply to Comment 120912
...are dwarfed by the perils of being a pedant.
By Crispy (registered) | Posted March 18, 2017 at 16:29:01 in reply to Comment 120918
I wish I could upvote this.
By KevinLove (registered) | Posted March 15, 2017 at 11:11:39 in reply to Comment 120918
Comment removed by website editor.
Comment edited by administrator Ryan on 2017-03-19 13:04:23
By kevlahan (registered) | Posted March 16, 2017 at 09:00:39 in reply to Comment 120930
Kevin,
You did not actually follow up the reference that Kathleen gave for the Cannon bike lane comments: Carter 2015! If you are going to start publicly attacking an undergraduate student for insufficient citation, at least be sure you are right.
Here is the quote, from the cited reference that gives exactly the source you claimed was missing:
Ferguson says that of the collisions reported on Cannon since the lanes went in, it's more often the case that cyclists have been at fault and "disobeying the rules of the road."
"Ferguson" is David Ferguson, the city's superintendent of traffic engineering.
Comment edited by kevlahan on 2017-03-16 09:14:56
By KevinLove (registered) | Posted March 17, 2017 at 07:12:19 in reply to Comment 120939
Comment removed by website editor.
Comment edited by administrator Ryan on 2017-03-19 13:04:41
By Tybalt (registered) | Posted March 17, 2017 at 11:07:15 in reply to Comment 120946
Kevin, this was a personal and public attack on the academic integrity of a vulnerable student, which you engaged in because you didn't like the content. It's unbelievably inappropriate. -Craig Burley
Comment edited by Tybalt on 2017-03-17 11:07:45
By KevinLove (registered) | Posted March 18, 2017 at 00:33:02 in reply to Comment 120948
Comment removed by website editor.
Comment edited by administrator Ryan on 2017-03-19 13:05:10
By Tybalt (registered) | Posted March 18, 2017 at 23:06:12 in reply to Comment 120951
I have no interest in discussing this further.
Comment edited by Tybalt on 2017-03-18 23:16:24
By Haveacow (registered) | Posted March 14, 2017 at 15:21:58
I forgot to mention much of the Lebreton Site has extremely toxic soil due to the railway, lumber industry and other heavy industries that used to be located there. The cost of soil remediation will be paid on a per development basis, as each new development begins construction. The Federal and Provincial governments using existing programs will put some money in, but only up to 15% of the total cost.
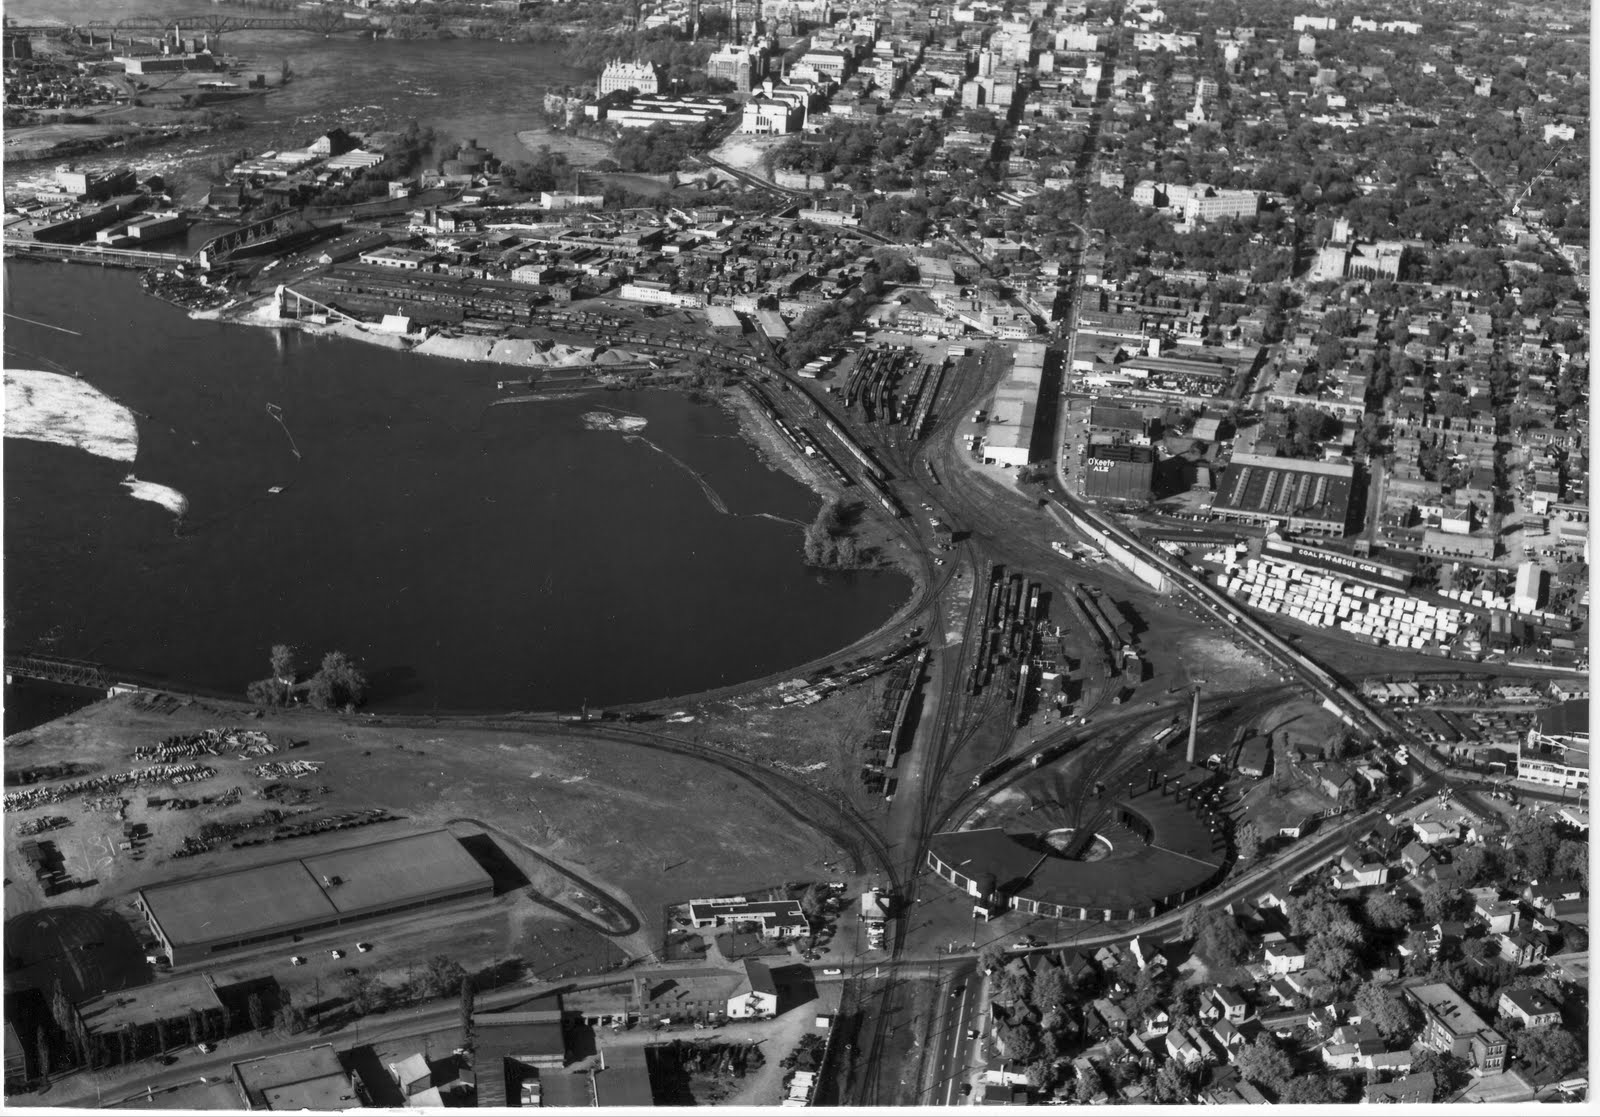
(What was there before)
http://www.centretownbuzz.com/wp-content...
http://www.histoireforestiereoutaouais.c...
(Below) Much of the Bayview station site was a Rail Yard, CP's famous Ottawa West Yards, with one of the largest Roundhouse Complexes in Canada. A big proportion of the large body of water you see, which is Nepean Bay, was filled in with rubble from the flattening of the Lebreton Flats in the late 1950's and early 1960's. The land has been vacant since expect for small developments and public housing on the south side of the extended Albert Street in the 1970's. The area of the roundhouse is now a local arena.
http://2.bp.blogspot.com/_eYv6opBqDv0/TD...
(Below) CPR's Broad Street Station alive and well in this early 20th century view on Lebreton Flats
https://upload.wikimedia.org/wikipedia/c...
(Below) All in one of view of the various plans in the Lebreton-Bayview Corridor with protected views of Parliament Hill.
By Haveacow (registered) | Posted March 14, 2017 at 15:34:36
For some reason the picture of the planned Bayview LRT Station didn't appear here is the link.
By Haveacow (registered) | Posted March 14, 2017 at 16:05:21
Here is the all in one view that did not translate in the last comment.
By Kevin (registered) | Posted March 14, 2017 at 16:59:26
Really great article, Kathleen. Thank you. I wish more young women would write for RTH.
By Haveacow (registered) | Posted March 15, 2017 at 12:41:24
Everybody cut Kathleen some slack, I see so much of this stuff in my professional life its no better or worse than what professional urban planners, engineers, designers and architects have to pump out day after day. We all have our various strengths and weaknesses. Most of those professional reports put out by cities and professional consultancies are worked on and massaged by whole groups of people, 4 or more people sometimes, just doing the editing before it goes out to the public. Not a single and most likely, overworked student. If anything, the only thing I would really be even remotely critical about is that very little of this report is new information. However, since it was written in the form of a synopsis anyway, I really can't be too critical when she did exactly what she set out to do, in a very short amount of space I might add.
I once had to do a report to a conference whose main theme was the state of transportation planning in the urban and suburban operating environment of North America. My "book" as it was called, was about the conversion of Ottawa's BRT system to LRT operating technology. It was 65 pages long, with nearly 30 pages of appendices, definitions, references and citing of points. I considered this level of citing to be utterly ridiculous but it had to be done that way. I was told that, the report was going out to a varied group of professional people who may or may not be familiar at all with the subject matter. When the conference was over I was told how impressed everybody was with the final product but why did I have to put so much, "needless referencing and definitions crap at the end!" That was coming from professionals! Kathleen is an engineering student and I have personally seen a lot worse being pumped out by so called professional engineers.
By mdrejhon (registered) - website | Posted March 16, 2017 at 20:04:20 in reply to Comment 120933
Indeed. It's still a piece much better than what I've seen many professionals do.
By Pxtl (registered) - website | Posted March 16, 2017 at 08:56:29
To be fair, you're referencing the 2010 IBI report which discussed overcrowding - iirc, the city has said that the allocation of buses to major routes following the fare increase have seriously reduced the problem of pass-bys and crowding. That's probably the biggest application of the 2010 IBI recommendations, since we sure didn't do the rest of the stuff in there.
By Tybalt (registered) | Posted March 17, 2017 at 11:04:36
Thank you so much for posting a useful and engrossing piece and do please ignore the attacks on your academic integrity.
You must be logged in to comment.
There are no upcoming events right now.
Why not post one?