When Ford says Ontario's spending is out of control, he's lying. When he says he can cut spending without cutting service, he's lying.
By Ryan McGreal
Published June 05, 2018
The conventional wisdom on Ontario's government finances is that our government has an out-of-control spending problem with runaway deficits and debt. There's one big problem with this narrative: it's just not true. As the data show, Ontario has a revenue problem, not a spending problem.
I pulled the Provincial Fiscal References Table data from Statistics Canada and combined it with Provincial population totals so in order to normalize the numbers on a per-capita basis. When you compare Ontario to the other Canadian provinces in per-capita revenue and spending, it becomes clear that our taxing and spending are on the low end.
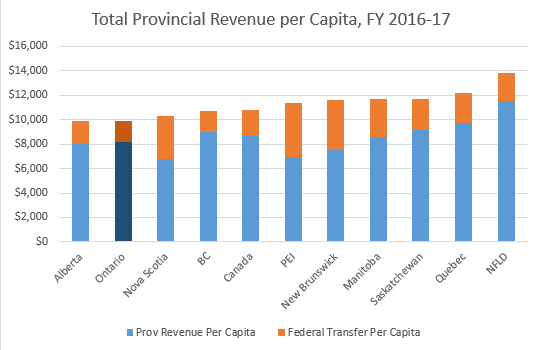
For fiscal year 2016-2017, Ontario's per-capita provincial revenue was $8,186, $489 lower than the national average of $8,675. We also received $1,729 per-capita in federal transfer payments, which is $365 lower than the national average. As a result, our total per-capita revenue was $9,915, $854 lower than the national average and essentially tied with Alberta as the lowest in the country.

Chart: Total Provincial Revenue per Capita, FY 2016-17
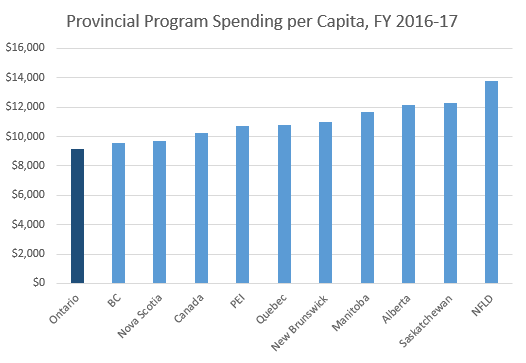
Since Ontario collects less revenue, it has less money to spend on programs. And sure enough, our per-capita program spending is $9,160, once again the lowest in the country. The average is $10,253, or $1,093 more.

Chart: Provincial Program Spending per Capita, FY 2016-17
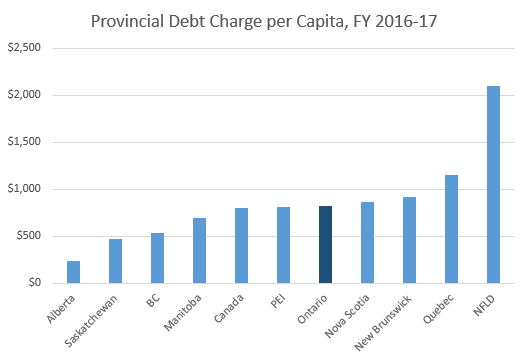
At this point, the fiscal scolds will insist that spending is also constrained by Ontario's debt charges, but in this measure we are actually similar to other provinces. Ontario's per-capita debt charge was $825, or just $26 higher than the national average of $799.

Chart: Provincial Debt Charge Per Capita, FY 2016-17
The absolute dollar value of our debt is large, but that's mainly because Ontario is a big province with nearly 40 percent of the entire country's population. That's why it's important to normalize provincial revenue and spending per capita, so we can compare apples to apples.
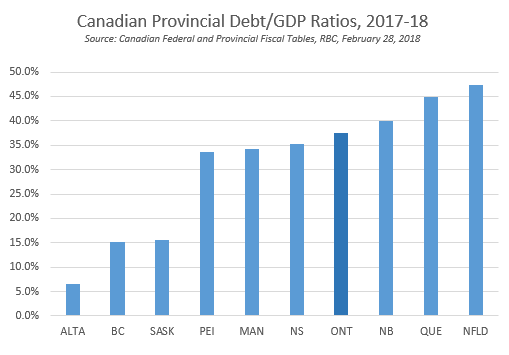
Another way to normalize the size of the debt is as a share of the total gross domestic product (GDP) of the economy. Again, Ontario's debt-to-GDP ratio is slightly higher than average for the country but hardly out of control.

Chart: Canadian Provincial Debt-to-GDP ratios, 2017-18
When you consider that our program spending is lower than average and our total revenue is the lowest in the country, it's clear what is driving the increase in our total debt over the past several years: we're not spending too much, we're collecting too little. We have been trying, and failing, to fund civilized public services on an inadequate neoliberal tax policy.
There are only two ways out of this situation. One is to cut program spending, and the other is to increase revenues so that we collect enough to fund our public services.
Progressive Conservative leader Doug Ford insists he can increase program spending and reduce the overall budget without cutting services or laying public employees off. Like so much of what he says, that's pure nonsense. If there were billions of dollars in "efficiencies" to be found in the Provincial budget, the Auditor-General would have already found them.
But Ford also promises billions of dollars in tax cuts at the same time, further reducing how much money the province has to spend. As we already know, Ontario already has the lowest per-capita government revenue in the country.
The only way Ford can cut significant spending out of the budget is through massive cuts to public services - exactly as former PC Premier Mike Harris did in 1995, and exactly as Ford himself did during his Council term as Toronto's shadow mayor.
Back then, Ford and his brother also claimed they could save money through "efficiencies", and it turned out to be just another lie. This is the same guy who threatened that he would close his own ward's libraries "in a heartbeat" when he was a councillor. Thankfully, cooler heads prevailed and Council rejected the Fords' proposed firesale.
If Ontarians elect a Ford government this Thursday, there will be no cooler heads left to stop him: a bloodletting of service cuts and privatizations is both ideologically guaranteed and mathematically inevitable. There's a very clear reason Ford has already broken his promise to deliver a costed platform: there is no universe in which the numbers he has been bandying around will add up.
In the absence of any kind of a plan we can evaluate, we must resort to judging Ford's intentions by his own clear history of promising "efficiencies" and then delivering service cuts and privatizations.
When Ford says Ontario's spending is out of control, he's lying. When he says he can cut spending without cutting service, he's lying. Don't believe the lie.
| Province | Provincial Revenues (millions) | Federal Transfers (millions) | Total Revenues (millions) | Program Expenditures (millions) | Debt Charges (millions) | Total Expenditures (millions) | Population | Prov Revenue Per Capita | Federal Transfer Per Capita | Total Revenue per Capita | Program Expenditure per Capita | Debt Charge per Capita | Total Expenditure per Capita |
|---|---|---|---|---|---|---|---|---|---|---|---|---|---|
| Alberta | $34,425 | $7,979 | $42,404 | $52,170 | $1,018 | $53,188 | 4,286,134 | $8,032 | $1,862 | $9,893 | $12,172 | $238 | $12,409 |
| BC | $43,292 | $8,167 | $51,459 | $46,135 | $2,587 | $48,722 | 4,817,160 | $8,987 | $1,695 | $10,682 | $9,577 | $537 | $10,114 |
| Manitoba | $11,526 | $4,117 | $15,643 | $15,577 | $938 | $16,515 | 1,338,109 | $8,614 | $3,077 | $11,690 | $11,641 | $701 | $12,342 |
| New Brunswick | $5,707 | $3,119 | $8,826 | $8,362 | $695 | $9,057 | 759,655 | $7,513 | $4,106 | $11,618 | $11,008 | $915 | $11,923 |
| NFLD | $6,096 | $1,224 | $7,320 | $7,288 | $1,112 | $8,400 | 528,817 | $11,528 | $2,315 | $13,842 | $13,782 | $2,103 | $15,885 |
| Nova Scotia | $6,459 | $3,354 | $9,813 | $9,263 | $824 | $10,086 | 953,869 | $6,771 | $3,516 | $10,288 | $9,711 | $864 | $10,574 |
| Ontario | $116,190 | $24,544 | $140,734 | $130,016 | $11,709 | $141,725 | 14,193,384 | $8,186 | $1,729 | $9,915 | $9,160 | $825 | $9,985 |
| PEI | $1,058 | $675 | $1,732 | $1,626 | $124 | $1,750 | 152,021 | $6,960 | $4,440 | $11,393 | $10,696 | $816 | $11,512 |
| Quebec | $81,968 | $20,498 | $102,466 | $90,387 | $9,687 | $100,074 | 8,394,034 | $9,765 | $2,442 | $12,207 | $10,768 | $1,154 | $11,922 |
| Saskatchewan | $10,671 | $2,955 | $13,626 | $14,301 | $544 | $14,844 | 1,163,925 | $9,168 | $2,539 | $11,707 | $12,287 | $467 | $12,753 |
| Canada | $317,392 | $76,632 | $394,023 | $375,125 | $29,238 | $404,361 | 36,587,108 | $8,674.97 | $2,095 | $10,769 | $10,253 | $799 | $11,052 |
By KevinLove (registered) | Posted June 06, 2018 at 20:58:02
If Ontarians elect a Ford government this Thursday, there will be no cooler heads left to stop him
But there are! One of the great advantages of our parliamentary democracy is that even if he leads a majority government, Mr. Ford must maintain the confidence of his backbenchers in order to remain Premier. If he does something crazy, his backbenchers can force him out.
That is how Margaret Thatcher was removed from power.. Her backbenchers rebelled and forced her out.
By ASmith (registered) | Posted June 06, 2018 at 22:22:02
Here are some more numbers...
Between 2002-03 to 2016-17, program spending in Ontario has increased an avg of 5.8% ( $59B to $130B). In the same period, Ontario's GDP (market prices, no inflation adjustment) has only grown by 3.7% ( $477.8B to $794.8B).
Between 1995 - 2003, the PC's increased program spending from $44.5B in 1994-95, to $59.1B in 2002-03, an avg increase of 3.6%. In contrast, GDP grew from $307.5B to $477.8B, an avg increase of 5.7%.
Big government sucks up valuable capital and wastes it. Businesses and individuals invest their capital to make a profit. The government "invests" it's/our capital to get re-elected.
Both parties invest, but only the former has a sharp eye on cutting costs and maximizing revenue. The govt, because it gets paid a flat salary, doesn't really care about how profitable their investments are. All they care about is spreading the money in the right ridings so they get the most votes.
That said, it's quite clear that Ontario needs a govt which puts a brake on spending. The numbers don't lie. Ontario has squandered billions with little to show for it.
Time for a change.
By Ted Mitchell (registered) | Posted June 07, 2018 at 18:49:40 in reply to Comment 123032
The TSX nearly tripled from 1995-2000 until the dotcom crash. In comparison, it has only doubled from 2002-2018. East Asian manufacturing has exploded in the meantime, driving down labour wages and decimating middle class union employed families in North America and elsewhere in the western world. All of which are mostly Kathleen Wynne and Dalton McGuinty's fault.
TSX historical data, check any date range here:https://tradingeconomics.com/canada/stock-market
True, lots of waste with ehealth, gas plant fiasco, ornge, etc but these are worthwhile government programs that could not be replaced by private corps at the noncompetitive trough of public funding. They failed because they suffered from mistakes of incompetence in management and could have all been prevented with better public transparency. No party is advocating for more transparency and participatory democracy, they all mistakenly consider themselves experts. Which is even more damaging than toxic partisanship
You must be logged in to comment.
There are no upcoming events right now.
Why not post one?