Vision Zero calls for a commitment to 30 km/h speed limits on most city streets in part because a vehicle's stopping distance increases dramatically with its speed.
By Ryan McGreal
Published August 29, 2016
Back in April, I unpacked some of the physics behind the Vision Zero commitment to 30 km/h speed limits. More recently, Michelle Martin followed up with a thoughtful look at the cognitive psychology factors, particularly the reduction in peripheral vision at higher speeds.
But there's another component to vehicle speed that should push us toward embracing lower vehicle speeds: the stopping distance of a moving car. Obviously, a big part of making roads safer is preventing crashes and collisions, and a shorter stopping distance means it is more likely a driver can brake to avoid colliding with another driver, a cyclist, a pedestrian, or something else.
The general way to calculate braking distance is through the formula:
distance = v^2/2μg
where v is the initial velocity, μ is the coefficient of friction (between 0 and 1) and g is the gravity of the earth.
But stopping distance also includes the time the driver spends thinking before beginning to apply the brakes. A highly skilled, alert driver can start to brake in a little over half a second, but the average driver will take at least a second and some drivers, including elderly drivers with slower reaction times, can take 1.5 seconds, two seconds or longer to react.
For dry asphalt, the coefficient of friction is usually around 0.7, though it is higher with anti-lock brakes. And of course, the earth's gravity is 9.8 metres per second per second.
So if we conservatively assume a one-second thinking time and a 0.8 friction coefficient for dry asphalt, we can calculate the total vehicle stopping distance at various speeds.
| Speed (km/h) | Distance (m) | ||
|---|---|---|---|
| Thinking | Braking | Total | |
| 10 | 2.78 | 0.49 | 3.27 |
| 20 | 5.56 | 1.97 | 7.52 |
| 30 | 8.33 | 4.43 | 12.76 |
| 40 | 11.11 | 7.87 | 18.98 |
| 50 | 13.89 | 12.30 | 26.19 |
| 60 | 16.67 | 17.72 | 34.38 |
| 70 | 19.44 | 24.11 | 43.56 |
| 80 | 22.22 | 31.49 | 53.72 |
| 90 | 25.00 | 39.86 | 64.86 |
| 100 | 27.78 | 49.21 | 76.99 |
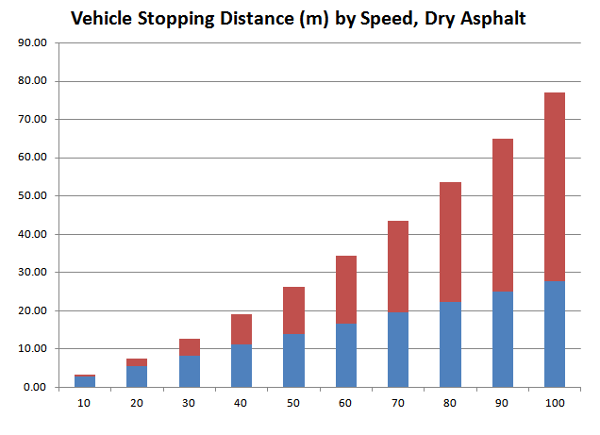
In the stacked bar chart below, the blue bar is thinking distance and the red bar is stopping distance.

Chart: Vehicle Stopping Distance by Speed, Dry Asphalt
Between 30 and 40 km/h, the stopping distance increases by 50 percent!
If the asphalt is wet or icy, the coefficient of friction is significantly reduced. Let's look at the same vehicle speeds but with a friction coefficient of 0.4:
| Speed (km/h) | Distance (m) | ||
|---|---|---|---|
| Thinking | Braking | Total | |
| 10 | 2.78 | 0.98 | 3.76 |
| 20 | 5.56 | 3.94 | 9.49 |
| 30 | 8.33 | 8.86 | 17.19 |
| 40 | 11.11 | 15.75 | 26.86 |
| 50 | 13.89 | 24.60 | 38.49 |
| 60 | 16.67 | 35.43 | 52.10 |
| 70 | 19.44 | 48.23 | 67.67 |
| 80 | 22.22 | 62.99 | 85.21 |
| 90 | 25.00 | 79.72 | 104.72 |
| 100 | 27.78 | 98.42 | 126.20 |
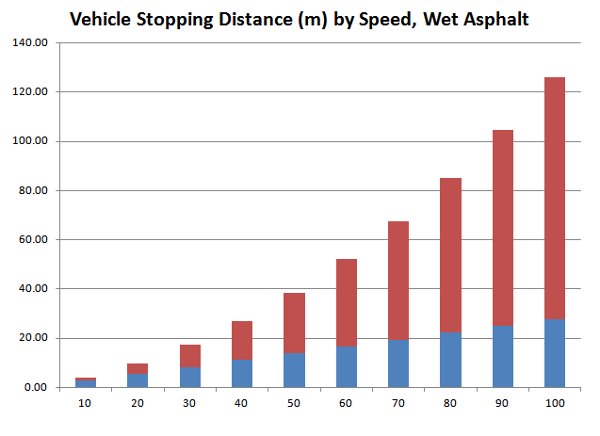
Again, in the stacked bar chart below, the blue bar is thinking distance and the red bar is stopping distance.

Chart: Vehicle Stopping Distance by Speed, Wet Asphalt
At a higher vehicle speed, not only does a vehicle have more kinetic energy, but it also takes a much longer distance to come to a stop, reducing the chance that the driver will be able to avoid a collision in the first place.
Combined with the fact that peripheral vision decreases, as speed goes up, the evidence is overwhelmingly clear: if we want streets that are safe for all the people using them, including people walking and people biking, we need to reduce vehicle speeds.
This is why the global Vision Zero movement is calling for a 30 km/h speed limit. At higher speeds, it is simply not possible to make our streets safe and inclusive.
If you want to play around with the stopping distance formula, the following form will calculate thinking, braking and total stopping distance based on the values in the input boxes above it.
| Speed (km/h) | |
|---|---|
| Thinking Time (s) | |
| Friction Coefficient (0-1) | |
| Thinking Distance (m) | 8.33 |
| Braking Distance (m) | 4.43 |
| Total Distance (m) | 12.76 |
By KevinLove (registered) | Posted August 29, 2016 at 13:37:42
Although 30 km/hr is a big step forward, lower speed limits are not enough.
What is necessary is to separate and protect vulnerable people from dangerous machinery. Every factory in Hamilton does this, because the Ministry of Labour really does practice Vision Zero.
What this means in practice ranges from car-free zones to physical guards of steel and concrete to unravelling the transportation routes of people vs. car drivers.
By mdrejhon (registered) - website | Posted August 30, 2016 at 12:54:28
I have a comment: Patience level of drivers
There are drivers find it fun and calm to drive slowly through the cacophony of downtown core, just merrily inching slowly forward and enjoying the sun, glancing at the scenery, incidentally noticing new businesses.
And there are drivers find it highly stressful, the sensory overload, rushing for an appointment, being used to a quicker drive in the past, and getting annoyed at the longer drive, accelerate quickly to the next car and stop quickly, etc.
There's a continuum in between.... One big side effect of converting an arterial (50kph) into a local road (30kph) is the status quo and change feels difficult. For the scenario of a theoretical King 30kph local car lanes next to LRT (slower speed compensating for the moving cars being more frequent adjacent to revitalized King sidewalks) it will likely piss off a lot of impatient drivers who haven't yet chosen to be patient or taking alternate routes -- it can take a long adjustment period (people taking other routes, e.g. widened RHVP, adjusted Barton, etc).
Hopefully the construction detour period is well-designed to let people become used to alternate routes.
Driving my car through a clogged revitalized business corridor is generally preferable (for me and a huge many others) than driving a stop-n-go rush-hour 401, but this may not be the case for every single individual, in what situations they get stressed during driving.
Comment edited by mdrejhon on 2016-08-30 12:59:07
By peterrush1 (registered) | Posted June 13, 2017 at 22:35:22
so you can look at the distance formula https://www.studypug.com/algebra-help/li... or you can look at the cost of society of a slow commute/transportation. It's difficult to quantify the cost of a human life, but we can quantify the cost of longer commute.
You must be logged in to comment.
There are no upcoming events right now.
Why not post one?